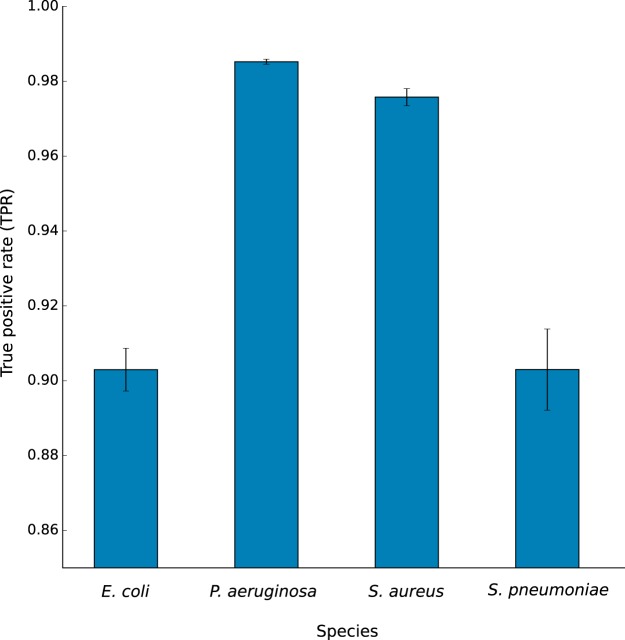
Fig. 3.
Bar plot showing the mean true positive rates and standard errors for pure cultures of E. coli, P. aeruginosa, S. aureus, and S. pneumoniae. E. coli and S. pneumoniae display lower true positive rates than P. aeruginosa and S. aureus, likely caused by the large number of closely related sequences in the reference database.

