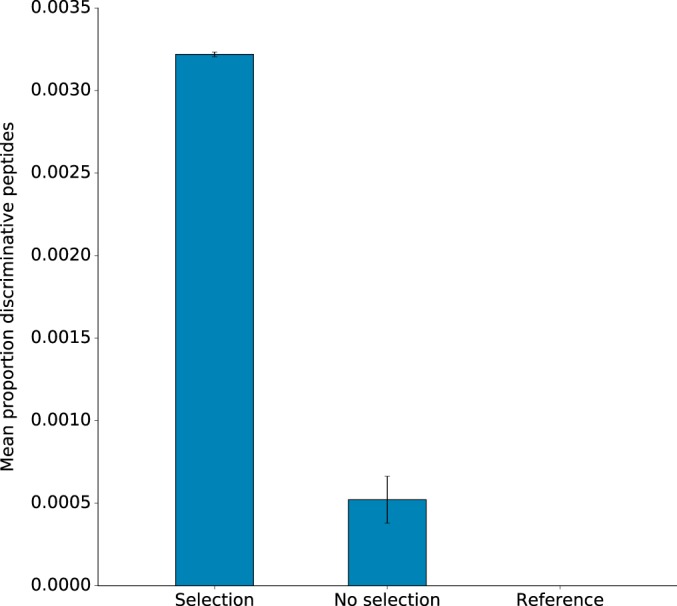
Fig. 5.

Bar plot showing the proportion and number of discriminative peptides assigned to CTX-M gene products. The left bar corresponds to E. coli strain CCUG 62462 grown under antibiotic selection pressure by cefotaxime; the center bar corresponds to E. coli strain CCUG 62462 grown without antibiotic selection pressure; and the right bar corresponds to E. coli reference strain K12/CCUG 49263 grown without antibiotic selection pressure.
