Fig. 6.
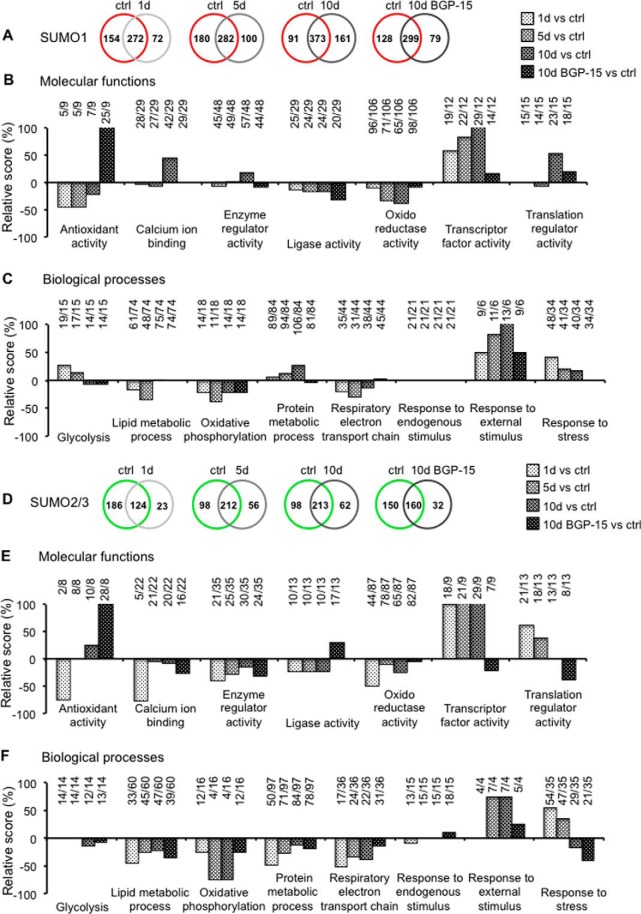
Gene Ontology analysis from identified SUMO1- and SUMO2/3-modified proteins. Venn diagram comparisons between controls SUMO1 (A, red circles) and SUMO2/3 (D, green circles) proteins with the MS/MS-identified SUMO substrates along the ventilation treatment after 1 day (1d, very light gray), 5 days (5d, light gray), 10 days without (10d, gray), and with (10d BGP-15, dark gray) BGP-15 drug. B and E, Statistical Gene Ontology analysis for selected molecular functions, and C and F, biological process terms were used to investigate the effects of mechanical ventilation treatment along the identified SUMOylated substrates per each time group compared with the control. Bars indicate the percentage of variation between the number of SUMO-identified proteins related to the specific GO subjects for each time of treatment compared with the correspondent SUMO identified proteins control (1d versus ctrl, 5d versus ctrl, 10d versus ctrl, and 10d BGP-15 versus ctrl). Ratios (X/Y) on top of each bar indicate X is the number of identified proteins in the treatment and Y is the number of protein in the control. The internal figure legend indicates the different fillings of the histogram bar represented the respective comparisons.

