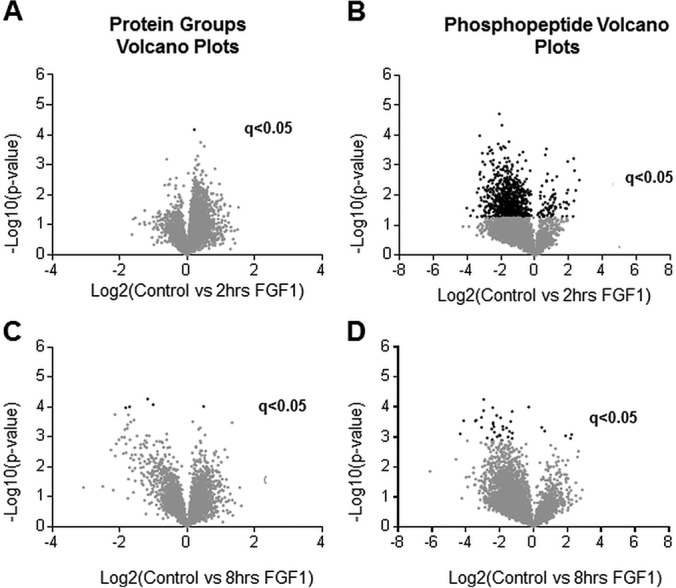
Fig. 2.

Volcano plots of quantified proteins and phosphopeptides. Volcano plots of global proteome (A, C) and phosphoproteome (B, D). (A) and (B) compare no treatment with 2 h of FGF1 treatment. (C) and (D) compare no treatment with 8 h of FGF1 treatment. A two-sided t test was performed correcting for multiple testing by controlling for FDR at 5%. Proteins or peptides with a q-value of less than 0.05 are considered significant. Data points in black are significant (q < 0.05).
