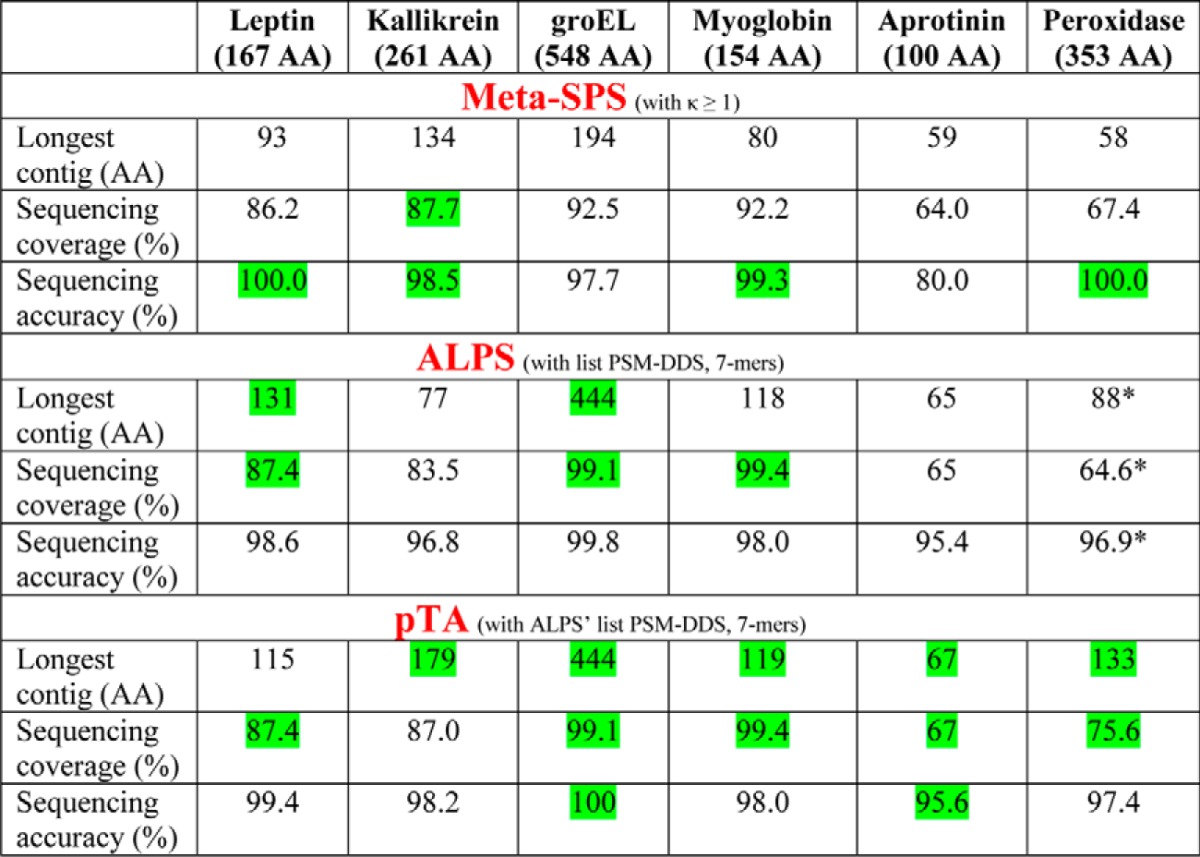
Table II. Assembly performance comparison between mSPS, ALPS, and pTA using proteolytic digest data as input.
A mixture of six proteins was digested with multiple proteases analyzed by LC-MS/MS. A comparison of the assembly performance of mSPS and ALPS on this dataset was presented in Table III of Ref. 8. Here, that table was adapted to contain pTA data, using the same list of peptides used as input by ALPS de Bruijn assembler (PSM-DDS). pTA results refer to assembled contigs in “contigs.csv” file. Green indicates the best result for each category. AA is amino acid.

* Slight modification to the original published table (8), which reflects correction of ALPS longest contig (seq5)-assembled sequence, in which the last 4 residues of seq5 are incorrect extensions and thus should not account for the calculations.
