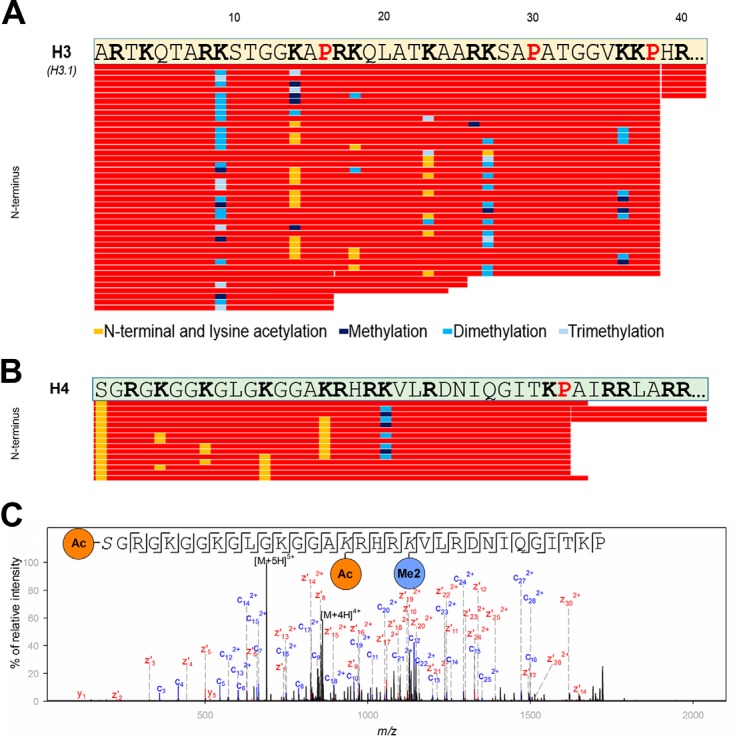
Fig. 5.

Histone H3 and histone H4 mapping using neprosin as identified within a digest of whole histones from calf thymus. A, sequence coverage plot of the N terminus (amino acids 1–40) of histone H3. Underlying peptides are shown as red bars in a sequence coverage plot. The retention time of the corresponding peptides was between 3 and 8 min. Pro residues are highlighted in red and bold, and Arg and Lys residues are shown in black and bold. Only those sequences are displayed for which the PTM site was confirmed based on manual inspection. Cleavages after Pro-16, Ala-24, and Ala-25 were only observed to minor extent. Legend for identified PTMs is provided in the figure. B, sequence coverage plot of the N terminus (amino acids 1–40) of histone H4. Underlying peptides are shown as red bars. Pro residues are highlighted in red and bold, whereas Arg and Lys residues are shown in black and bold. Only those peptides are displayed for which the PTM site was confirmed based on unambiguous corresponding fragment ions. Legend for identified PTMs is provided in the figure. C, exemplary fragment ion spectrum of an acetylated and dimethylated peptide of histone H4 (residues 1–32; precursor ion was at m/z 688.6046; z = 5) showing almost complete fragment ion series using EThcD.
