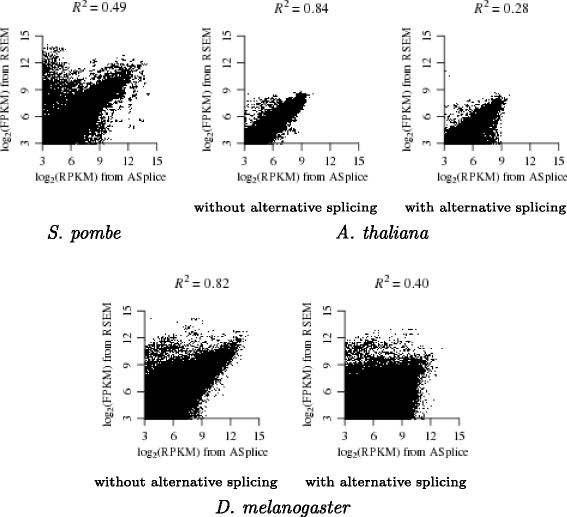
Fig. 4.

Regression in log scale of the de novo RPKM values from the 25_10 assembly (with k=25 and k-mer coverage cutoff c=10) of ASplice against the FPKM values from RSEM over all libraries. The gene transcript that corresponds to each node from ASplice is identified through a bi-directional nucleotide BLAST alignment of length at least 100 to the transcriptome of the same organism. Nodes that have no correspondences are ignored. For A. thaliana and D. melanogaster, regressions are performed separately on gene transcripts without alternative splicing and on gene transcripts with alternative splicing
