
Fig. 2.
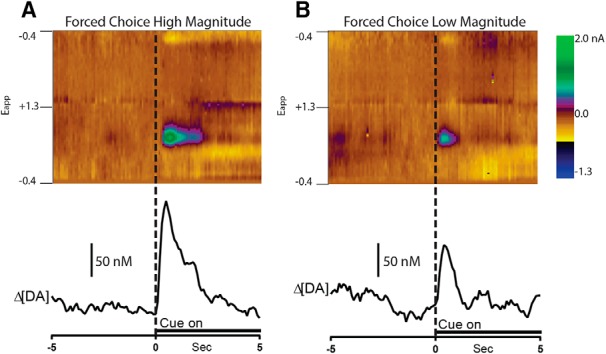
Example of differential dopamine release dynamics to the cue signaling high and low forced choice trials. Two-dimensional color representations of cyclic voltammetric data collected for 10 s around forced high-magnitude (A) and forced low-magnitude (B) trials in the NAc shell for a single representative animal. The ordinate is the applied voltage (Eapp) and the abscissa is time (s). Differential dopamine concentration [DA] determined via principal component analysis is plotted below the color plots.