Figure 6.
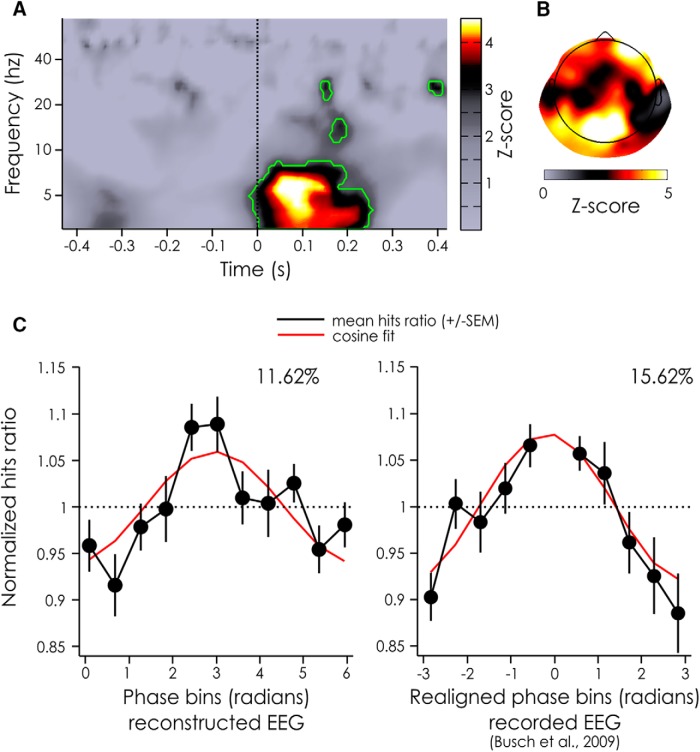
Z-score of POS for the reconstructed EEG and phase dependent performance. A, Z-scores of the POS values aggregated across electrodes and subjects for the reconstructed EEG for each time and frequency point. Significant time points after a FDR correction (α = 0.05) are outlined in green. B, Z-scores of the POS values aggregated across subjects for the reconstructed EEG at the frequencies and time points inside the largest significant cluster (from 3–8.17 Hz and from −12.5 ms to 250 ms, A). C, Normalized hits ratio depending on the phase bin for the reconstructed EEG at the peak significance (left hand side: 6.1 Hz, +75 ms). For comparison, previously published results linking detection performance and prestimulus phase of actually recorded (rather than reconstructed) EEG signals are replotted on the right hand side (7 Hz, −120 ms; taken from Busch et al., 2009). Both phase dependence curves are measured on the same fronto-central channel. Note that in our experiment the phase bins were not realigned between subjects, but that they were realigned (to produce peak performance at 0 for all subjects) for the experiment by Busch et al. (2009). The black line represents the mean across subjects (left hand side: 20 subjects, right hand side: 14 subjects), the bars represents the SEM, the red line represents a cosine fit, whose modulation amplitude (in %) is noted above the curve.

