
Figure 2.
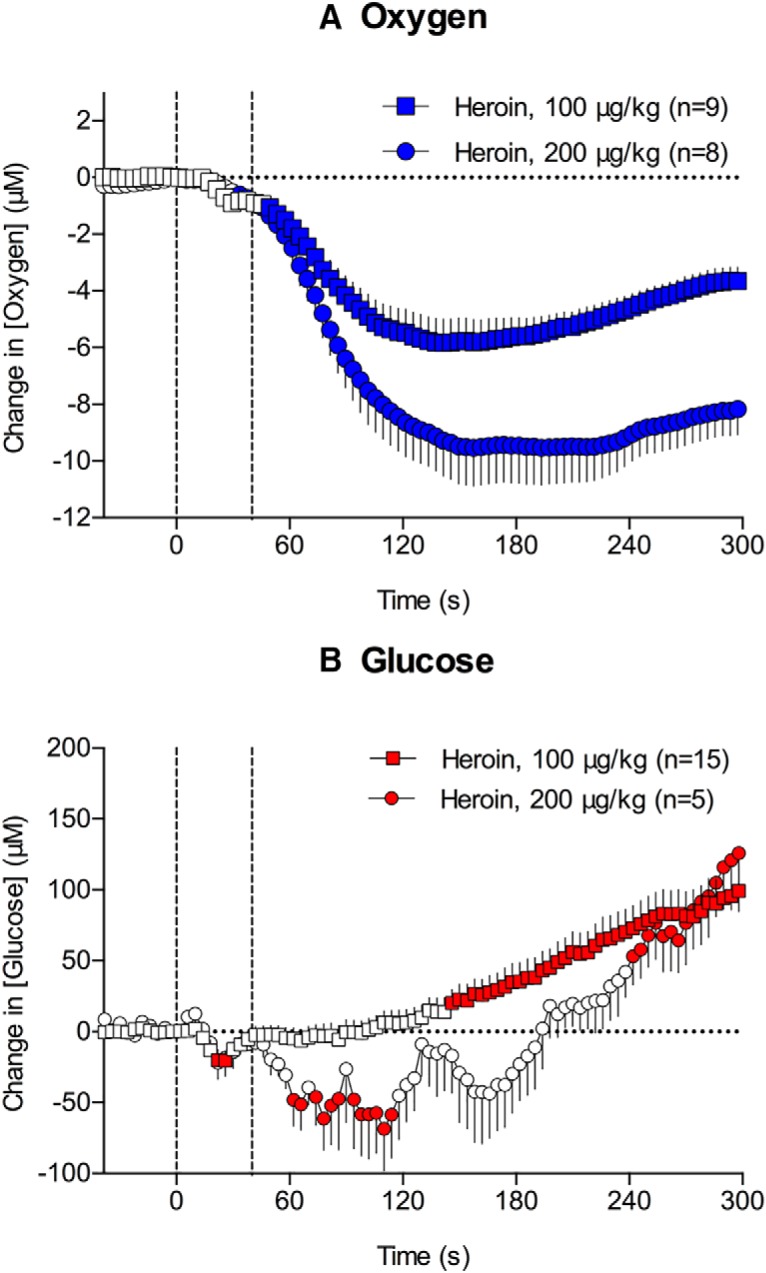
Rapid changes in NAc oxygen (A) and glucose (B) induced by intravenous heroin at 100 and 200 μg/kg doses. Circles represent 4-s mean (±SEM) changes calibrated in μM. n = number of averaged responses. Filled symbols show values significantly different from preinjection baseline. Vertical hatched lines show the onset and offset of heroin injection.