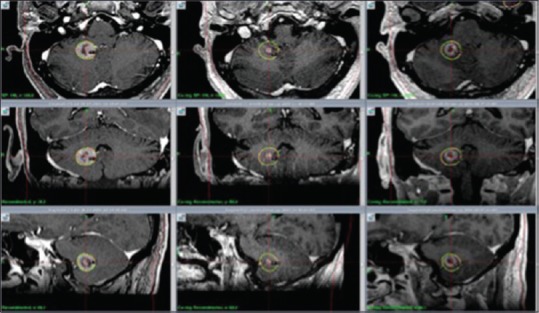
Figure 3.

M2: Axial, coronal and sagittal contrast enhanced T1 weighted MR images. RS 1 (day 1, left column); significant tumor volume reduction at 1 month (center column); volume increase, although still smaller than original treatment volume at 7 months (right column)
