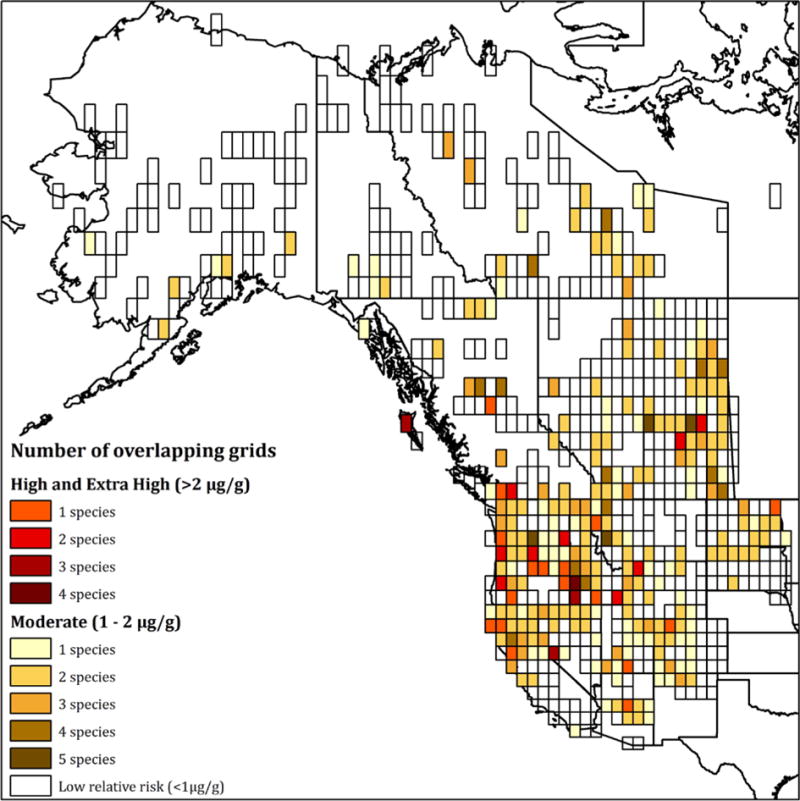
Figure 4.

Areas of western United States and Canada where fish modeling indicates high confidence in moderate or higher relative Hg risk. Light colors indicate fewer species with overlapping risk. Empty grid cells indicate areas where fish data was modeled but risk was estimated to be low. Areas not covered by grid cells either have least square mean estimates with low confidence or no fish data to use in the model.
