
Figure 1.
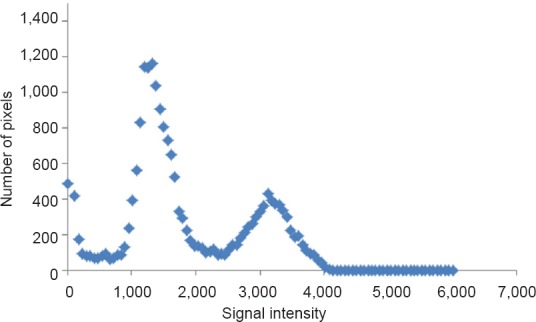
Bimodal histogram of a region of interest around the whole leg.
A midpoint between the 2 peaks indicates the cutoff point between muscle pixels (left peak) and fat pixels (right peak). The apex of each peak is used as a point of determination before both peaks average to determine the magic point.