Figure 2.

Risk of bias summary.
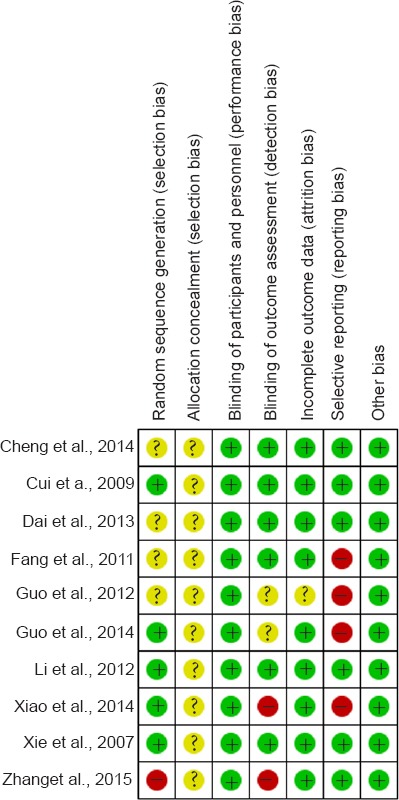
A review of the authors’ judgments on each risk of bias item for each included study. “+” represents “low risk”; “-” represents “high risk”; “?” represents “unclear”.

Risk of bias summary.
A review of the authors’ judgments on each risk of bias item for each included study. “+” represents “low risk”; “-” represents “high risk”; “?” represents “unclear”.