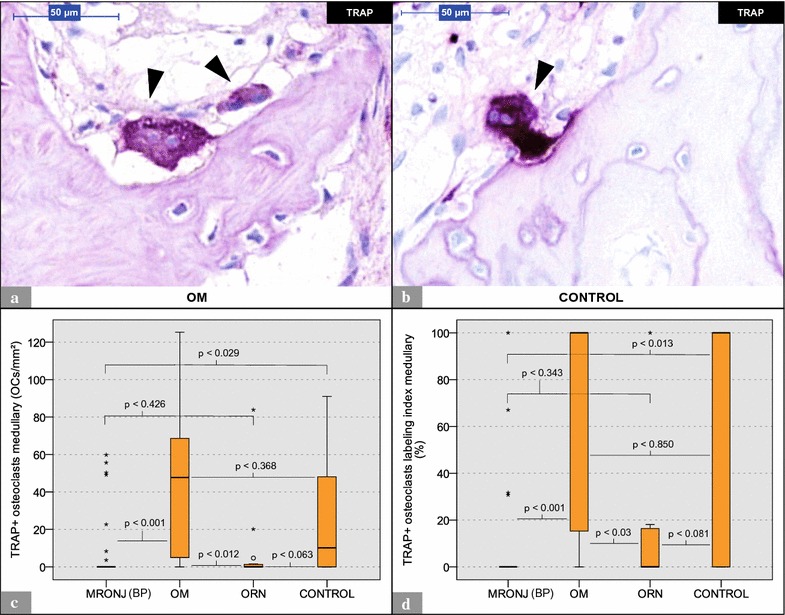
Fig. 3.

Analysis of TRAP staining: MRONJ (BP) vs. OM vs. ORN vs. control. a Shows 2 TRAP+ osteoclasts (arrowheads) within an OM histological section. b Depicts a TRAP+ osteoclast (arrowhead) within a control histological section. Note the direct contact with the bone surface. c Illustrates the number of TRAP+ osteoclasts per ROI. d Depicts the respective osteoclast labeling indices. * marks statistical outliers. For detailed data see Table 2. MRONJ (BP) medication-related osteonecrosis of the jaw secondary to bisphosphonate therapy, OC osteoclasts, OM osteomyelitis, ORN osteoradionecrosis, DC-STAMP dendritic cell-specific transmembrane protein, TRAP tartrate-resistant acid phosphatase
