
Fig. 1.
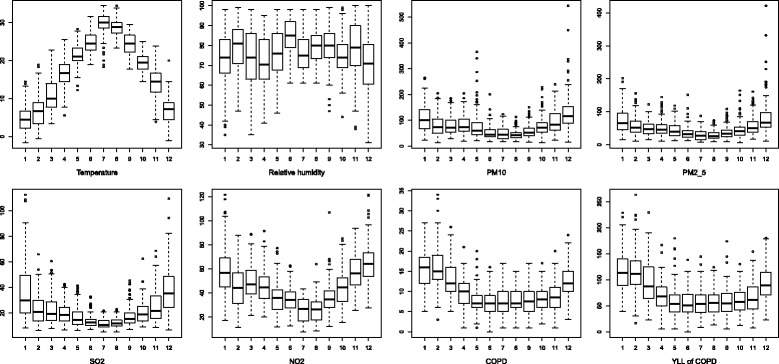
Boxplots of monthly PM2.5, PM10, SO2, NO2, temperature, relative humidity, years of life lost, death counts of COPD and the corresponding YLL in Ningbo, China, 2011–2015
Official websites use .gov
A
.gov website belongs to an official
government organization in the United States.
Secure .gov websites use HTTPS
A lock (
) or https:// means you've safely
connected to the .gov website. Share sensitive
information only on official, secure websites.
Boxplots of monthly PM2.5, PM10, SO2, NO2, temperature, relative humidity, years of life lost, death counts of COPD and the corresponding YLL in Ningbo, China, 2011–2015