
Figure 5.
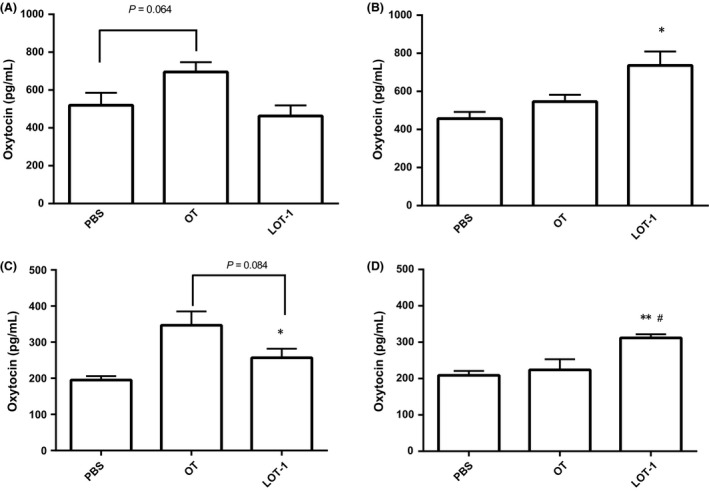
Plasma and cerebro‐spinal fluid oxytocin levels after injection of chemicals. Concentrations of OT in the plasma after 30 min (A) and 24 h (B), in cerebro‐spinal fluid after 30 min (C) and 24 h (D) in WT mice intraperitoneal treated with PBS, OT, or LOT‐1. One‐way ANOVA followed by Bonferroni's post hoc test revealed F 2,25 = 4.31, P = 0.0247 for A (n = 5–8), F 2,12 = 5.10, P = 0.025 for B (n = 4–7), F 2,17 = 7.28, P = 0.0052 (n = 6–8) for C, F 2,15 = 8.57, P = 0.0033 (n = 6). *P < 0.05, **P < 0.01 compared with PBS‐treated group, #P < 0.05 compared with OT‐treated group. OT, Oxytocin; PBS, phosphate‐buffered saline.