
Figure 1.
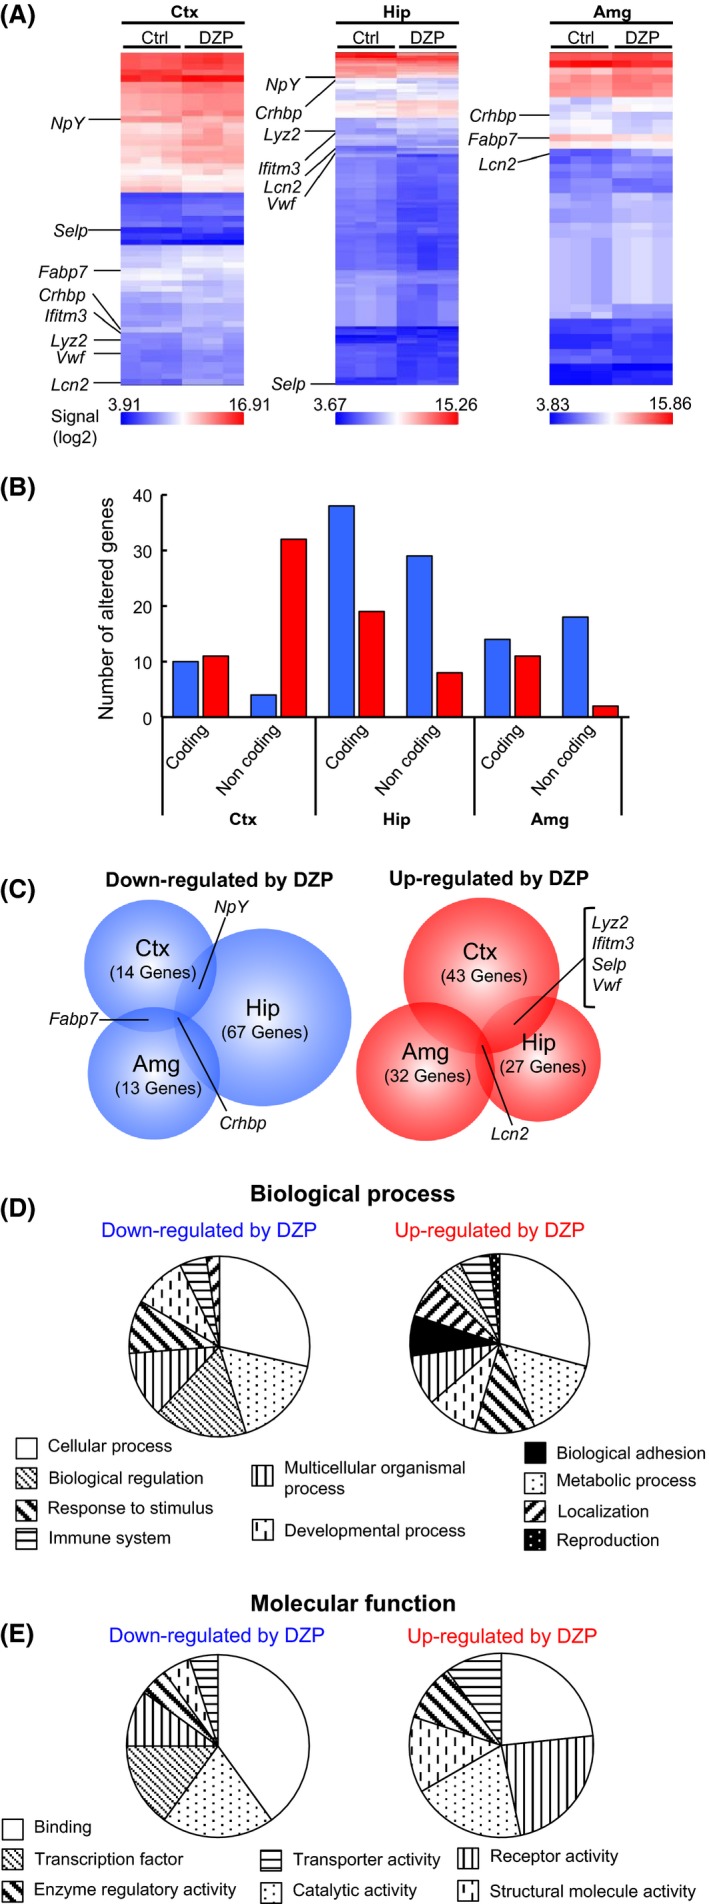
Global gene expression analyses of the cerebral cortex (Ctx), hippocampus (Hip), and amygdala (Amg) were performed via microarray in chronic DZP‐administered mice (DZP, n = 3) versus control mice (Ctrl, n = 3). In this analysis, the selection criteria are fold changes (1.5 ≤ or ≤ −1.5, P < 0.05), except for pseudogenes and predicted genes. (A) Hierarchical clustering heat map of the mean signal intensity (log2) of the target gene and its scattering within the same group. Several genes that overlap in more than two regions of the brain are indicated. (B) The number of genes altered by DZP are shown in a graph that is divided into brain regions: coding or noncoding and down‐ (blue bar) or upregulated (red bar). (C) Venn diagram shows down‐ (left) or upregulated (right) genes following DZP treatment. The lists of altered genes were obtained through a GO analysis corresponding to (D) Biological process or (E) Molecular function via PANTHER with a pie chart. The list of genes was combined with all regions and divided as down‐ or upregulated following DZP treatment.