
Figure 2.
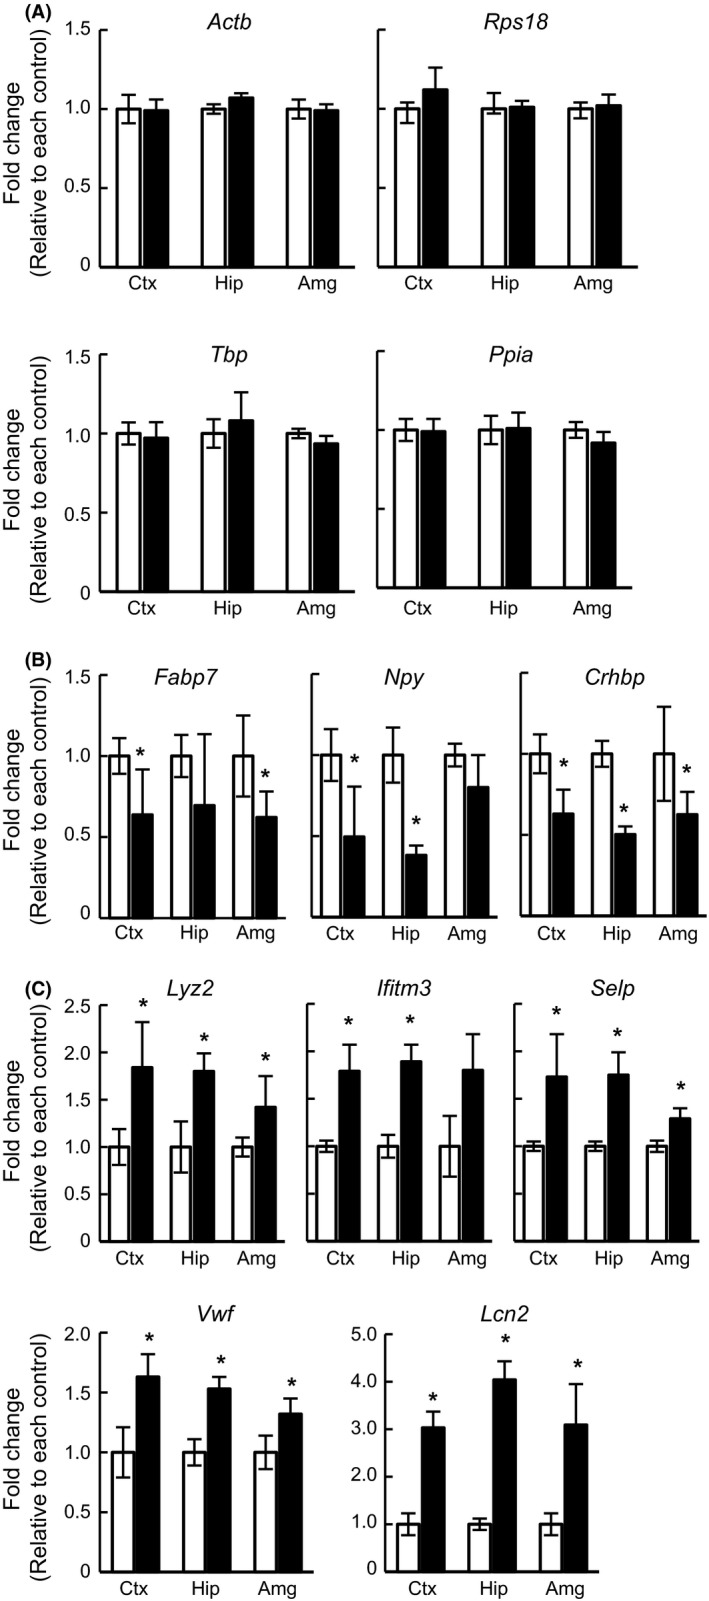
Gene expression levels of altered genes analyzed via microarray. The Y‐axis indicates the fold change compared with its control. Asterisks indicate statistically significant differences from the control (*: P < 0.05, ANOVA). (A) The relative expression levels of housekeeping genes, such as Actb, Rps18, Tbp, and Ppia, were not altered following chronic DZP administration. (B, C) The relative expression levels of (B) down‐ or (C) upregulated genes following DZP treatment. White bar: control group, Black bar: DZP group.