
Figure 6.
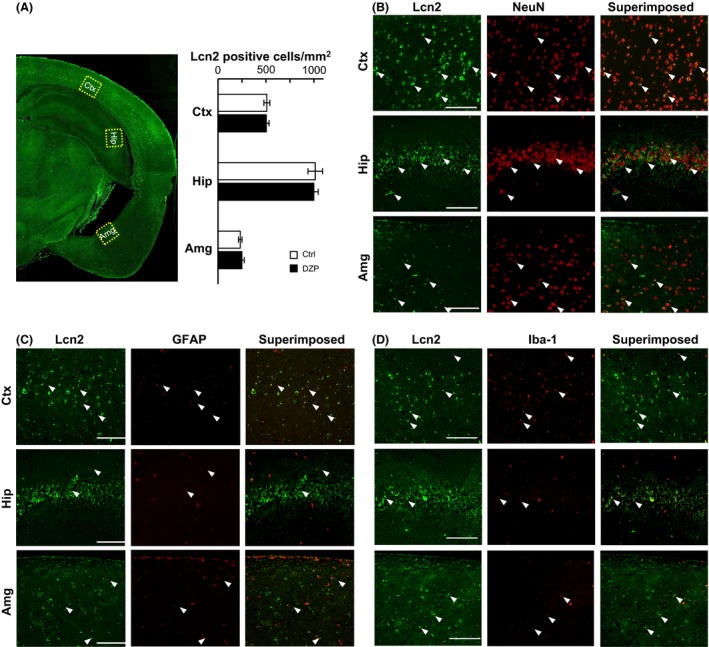
Immunohistochemical analysis to detect Lcn2 in the cerebral cortex (Ctx), hippocampus (Hip), and amygdala (Amg). (A) Photomicrograph showing the distribution of Lcn2 in a coronal section of control mouse. Lcn2‐positive cells in boxed area were counted and summarized in bar graph (Control: n = 4, DZP: n = 4). (B–D): Lcn2 was double stained with NeuN (B), GFAP (C), Iba‐1 (D). Each photomicrographs in B–D are enlarged view of the boxed area shown in (A). White arrowheads indicate some of double‐positive cells.