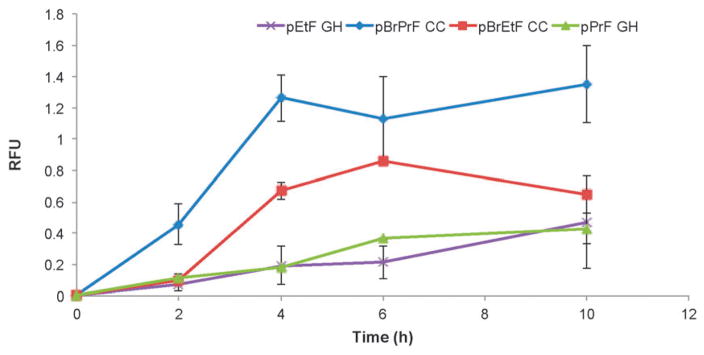
Fig. 4.
Comparison of alkyne reactions. Reactions were conducted either under the described Cadiot–Chodkiewicz conditions or the Glaser–Hay conditions at 4 ° C depending on incorporated UAA. Due to differences in protein levels resulting from oxidative damage, the ratio of fluorophore coupling for each data set was normalized to the 24 hour time point in order to compare coupling trends between reactions.

