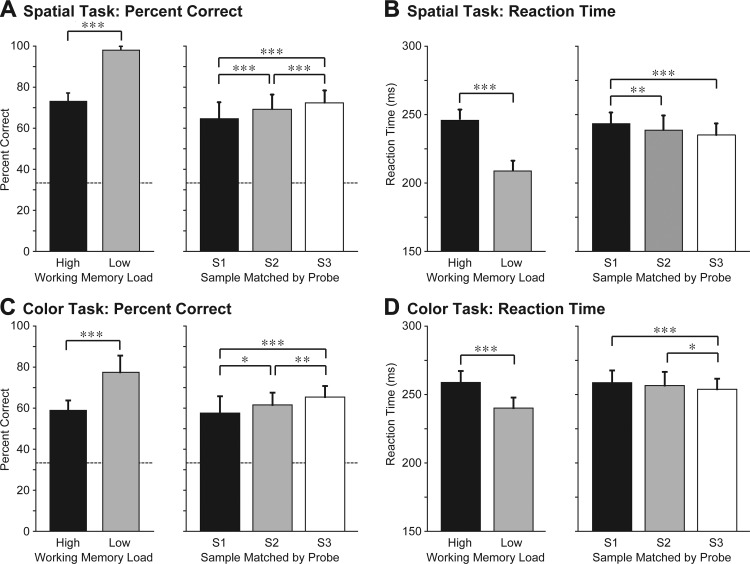
Fig. 2.
Behavioral performance. A and B: spatial task: data from monkey 1 and 2 (M1 and M2) combined. C and D: color task: M1 only. S1, S2, S3, samples 1, 2, and 3. Dashed lines indicate levels of performance expected by chance. *P < 0.05, **P < 0.0005, ***P < 0.00001, statistically significant differences. Quantification and breakdown by monkey are in Table 1.

