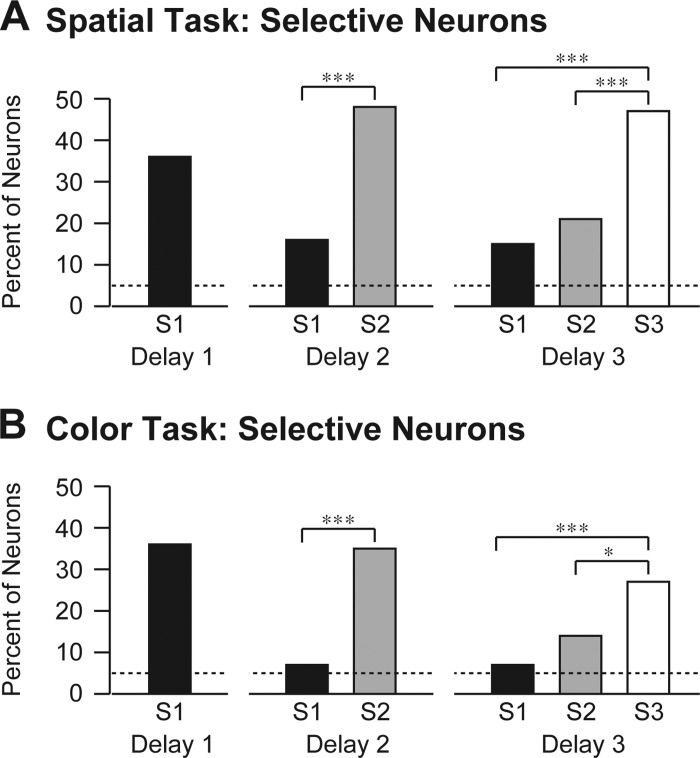
Fig. 7.
Neurons significantly selective for the most recent sample markedly outnumbered neurons selective for earlier samples. The height of each bar represents the percentage of neurons exhibiting significant selectivity for the indicated sample (S1, S2, and S3) during the indicated delay period in the spatial task (A) and the color task (B). Dashed lines indicate percentage expected by chance. *P < 0.05, ***P < 0.00001, statistically significant differences (χ2-test with Yates correction). Quantification and breakdown by monkey are in Table 3.

