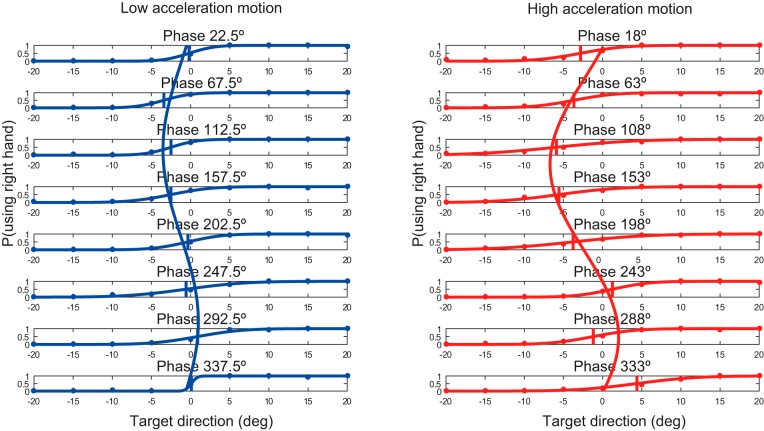
Fig. 4.
Psychometric curves representing hand choice of a representative subject during 8 possible phases of the motion. Left, low-acceleration motion. Right, high-acceleration motion. BTA is indicated as a vertical line for each phase. The curves overlaying the panels show the best-fit curves for this subject.

