Fig. 5.
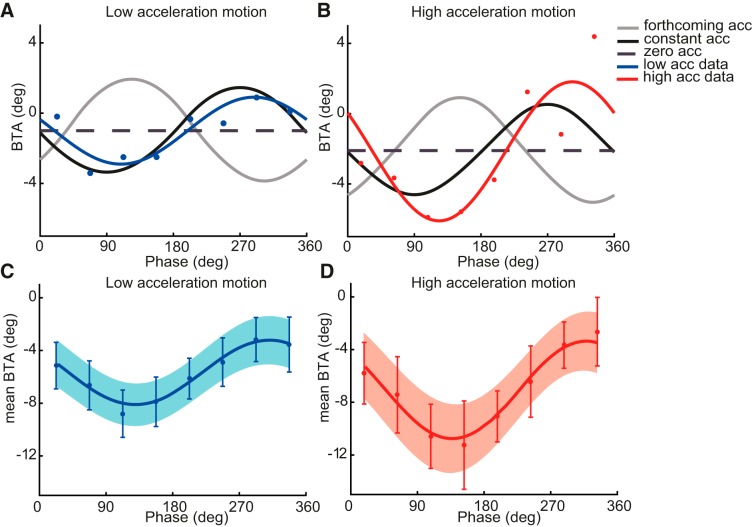
BTA as a function of phase. A and B: best-fit curves for the representative subject from Fig. 4 for low-acceleration (A; blue) and high-acceleration motion (B; red). Model predictions are shown for the forthcoming-acceleration (gray), constant-acceleration (black), and zero-acceleration hypotheses (dashed line). All curves were given a vertical offset to reflect the offset of this subject. C and D: mean sinusoidal fits of BTA. Data points indicate the mean BTA values of the individual psychometric fits, accompanied by mean SE bars, for the low-acceleration (C; blue) and high-acceleration phases (D; red). Shaded area indicates the SE of the mean sinusoidal fits.

