Figure 4.
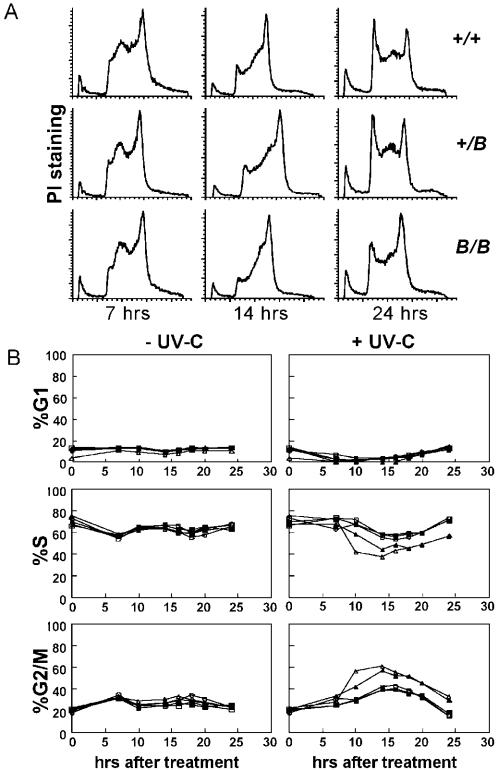
Cell cycle analysis of different ES cell lines generated in this study. (A) Cell cycle profiles of ES cells fixed 7, 14 and 24 h after exposure to UV-C (1 J/m2). +/+, wild type; +/B, Rev1+/; B/B, Rev1B/B. The x-axis, DNA content; y-axis, number of cells as determined by propidium iodide staining. (B) Modelled frequencies of G1-, S- and G2/M phase cells in unexposed (left panels) and in UV-C-exposed (right panels) cell populations. It is noted that many late S phase cells, visible in panel A, are inadvertently categorized as G2/M cells by the software. Open circle, wild type; closed triangle, Rev1B/B-254; open triangle, Rev1L−/B; open square, Rev1+/B; closed square, Rev1L+/B.

