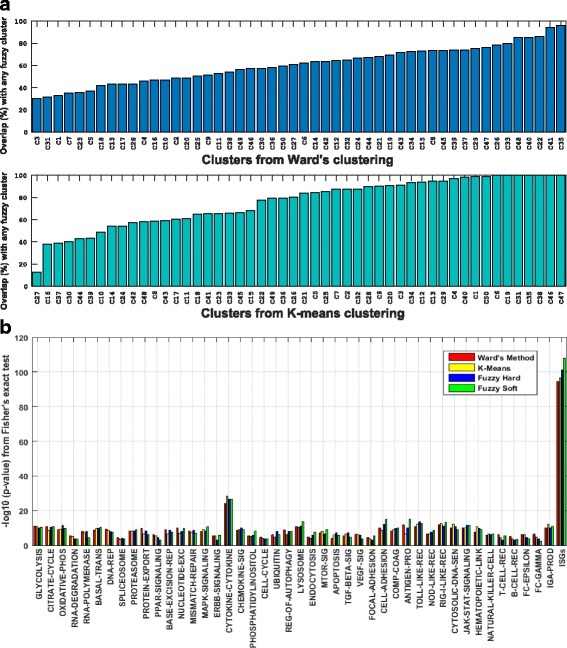
Fig. 6.

Comparison of FCM with hard clustering methods. a Number of genes overlapping between FCM gene-sets and k-means with Ward’s initialization (bottom), and Ward’s hierarchical clustering (top) and b the enrichment of ISGs and KEGG pathways by Fisher's exact test in clusters identified by K-mean, hierarchichal and FCM methods
