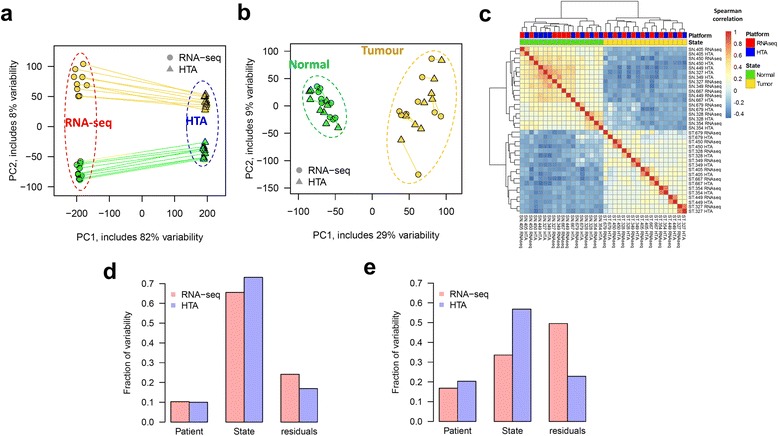
Fig. 1.

Data variability in two tissue states captured by different platforms: HTA and RNA-seq. PCA of log2 expression data for protein coding genes shows clustering based on platform for original data (a) and clustering based on tissue state for standardized data (b). Lines connect the same samples measured by the two platforms. The heatmap of Spearman correlations between expression profiles measured by both platforms shows that the major difference in gene order is tissue-related, not platform-related (c). The fraction of variability, determined by PVCA, is presented for protein-coding genes (d) and lncRNAs (e). Variability which cannot be explained by patient or tissue state is presented in the “residuals” group
