
Fig. 2.
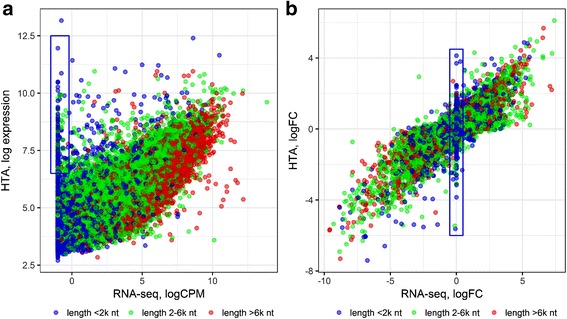
Scatter plots of coding mRNA expression captured by the two platforms. RNA-seq and HTA expression data for one sample (a) and logFC for one patient (b). Protein coding genes are visualized by gene length: blue – short, green – intermediate, red – long. The blue boxes highlight the genes missed by sequencing, but detected by microarrays