Fig. 6.

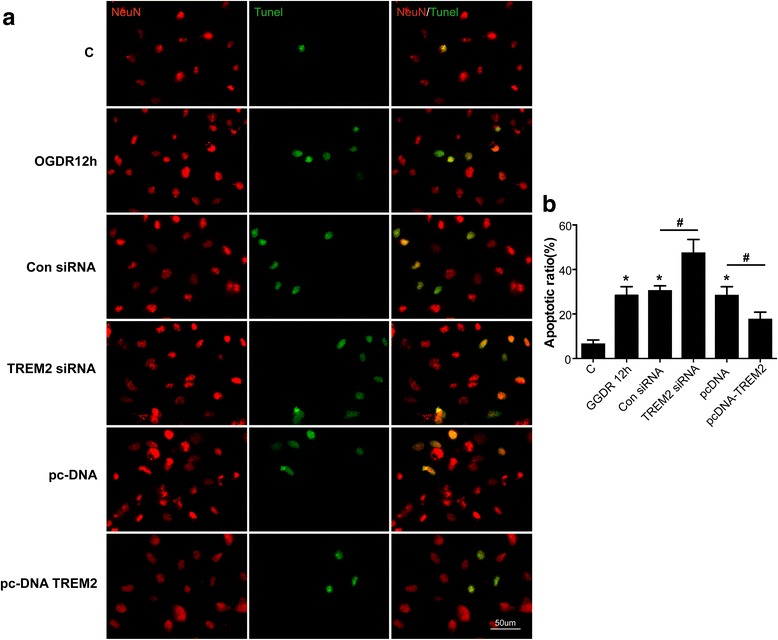
a Representative images of cells subjected to OGDR and transfected with either TREM2 siRNA or a TREM2 overexpression plasmid were immunostained with NeuN (red) and TUNEL (green). Scale bar, 50 μm. b The percentage of apoptotic neurons was calculated using image analysis software. Quantified data are shown as mean ± SEM; n = 5; *P < 0.05 compared with control group; # P < 0.05 compared with the control siRNA or overexpressing vector groups 12h after OGDR
