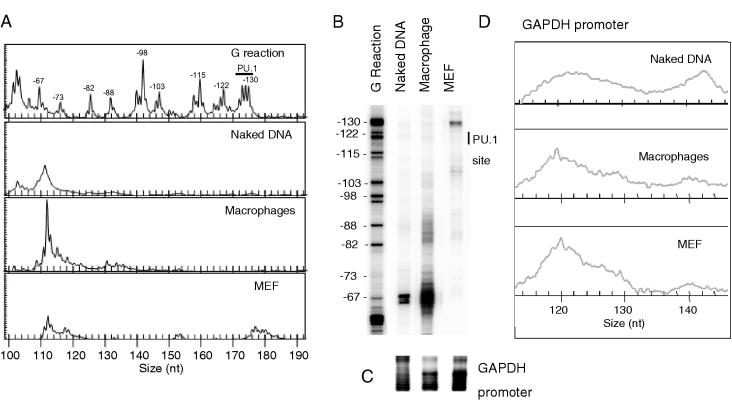
Figure 5.
Double-strand-specific break automated LM-PCR. (A) Capillary sequencer traces showing differences in MNase accessibility at the c-fms promoter between macrophages and fibroblasts. The position of the PU1 binding site and the distance from the major peaks relative to the ATG are indicated. (B) The same, but radiolabelled samples run on an acrylamide sequencing gel. The bands in the G reaction corresponding to the major peaks in the capillary sequencer trace are marked along with the transcription start sites. (C) Gel showing no differences in the GAPDH promoter MNase digestion control. (D) CEQ traces on GAPDH promoter digestion control showing a very similar pattern between the samples. Primers for the internal GAPDH control are coupled to the D3 dye, which excites at 650 nm and emits at 670 nm.

