
Fig. 2.
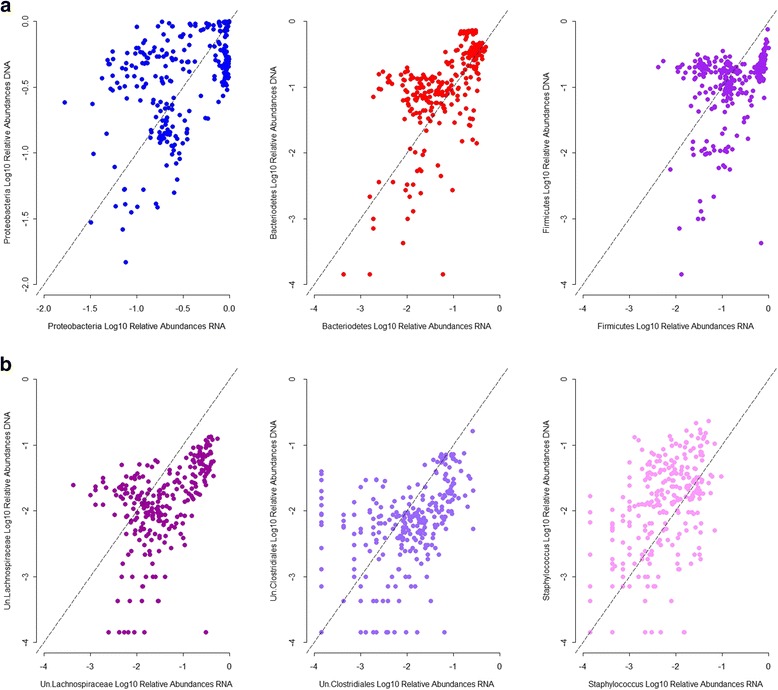
Correlation between standing and active relative abundances for representative taxa. a Phyla. b Genera. Spearman’s correlation: Proteobacteria: r = 0.42, p = 4.19 × 10⁻¹³; Bacteroidetes: r = 0.66, p = 3.3 × 10⁻¹⁶; Firmicutes: r = 0.39, p = 2.72 × 10⁻¹¹; Un.Lachnospiraceae: r = 0.56, p = 3.3 × 10⁻¹⁶; Un.Clostridiales: r = 0.50, p = 3.3 × 10⁻¹⁶; Staphylococcus: r = 0.48, p = 3.3 × 10⁻¹⁶. Un unclassified. p values are adjusted following Benjamini and Hochberg method [27]