
Fig. 6.
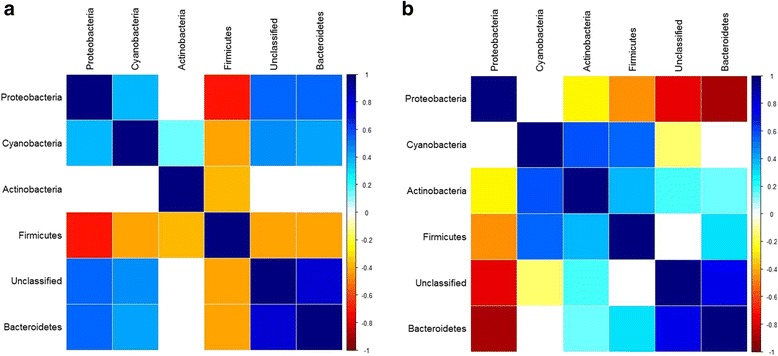
Correlations among CMM phyla in the standing communities of populations G4 and G15. a G4 population. b G15 population. Non-significant correlations (p > 0.05) after multiple testing correction are left blank
Official websites use .gov
A
.gov website belongs to an official
government organization in the United States.
Secure .gov websites use HTTPS
A lock (
) or https:// means you've safely
connected to the .gov website. Share sensitive
information only on official, secure websites.
Correlations among CMM phyla in the standing communities of populations G4 and G15. a G4 population. b G15 population. Non-significant correlations (p > 0.05) after multiple testing correction are left blank