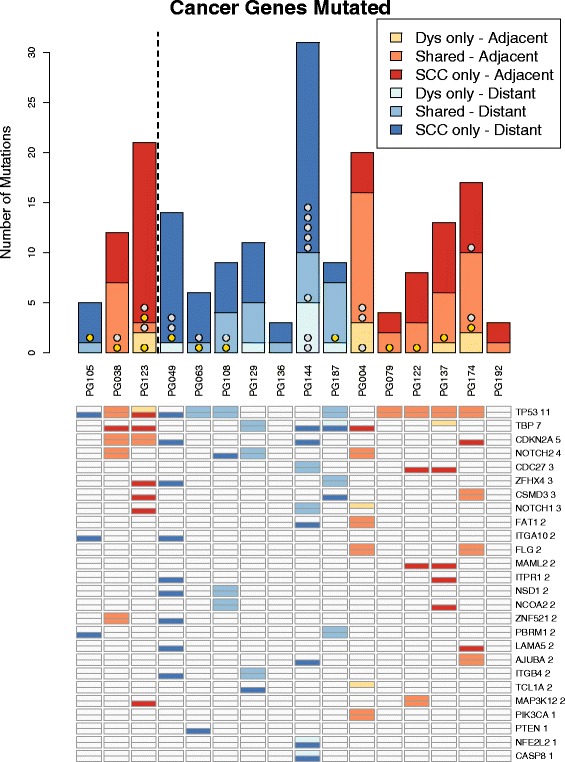
Fig. 10.

The variants seen affecting putative cancer pathways or lists of common HNSCC genes. TP53 mutations are shown in gold. Other common TCGA mutations are shown in silver. Any putative cancer gene mutated in more than one patient plus all common TCGA mutations are listed. Shades of orange indicate adjacent dysplasia–SCC pairs. Shades of blue indicate distant pairs. For each patient, the number of dyplasia-only, shared and SCC-only variants are shown. There are two rows for each gene; the top row indicates that it is mutated in dysplasia and the bottom row in SCC. So for TP53, for example, PG105 has a SCC-only mutation, PG038 has a mutation which is shared, and PG123 has different mutations in the dysplasia and SCC samples. All genes are shown in Additional file 1: Figure S8
