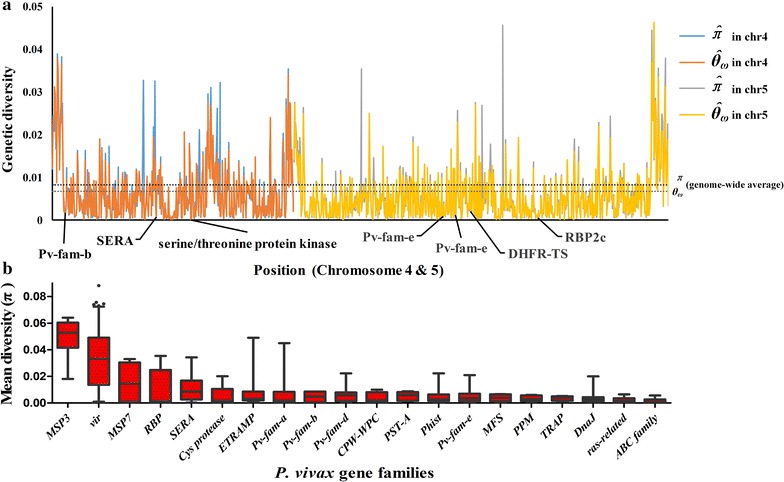
Fig. 4.

Diversity of P. vivax gene families and examples of selective sweep around some important genes in Chromosome 4 and 5. a Example of genetic diversity (y-axis) calculated in slide windows across Chromosome 4 and 5 (positions in x-axis). Dashed lines represent the genome-wide average of each diversity measure. b Mean pair-wise SNP diversity in P. vivax gene families. Gene families associated with merozoite invasion or immune response modulation show the highest diversity. Red bars on the box plots represent the 25th–75th percentile range, and dots indicate outlier genes
