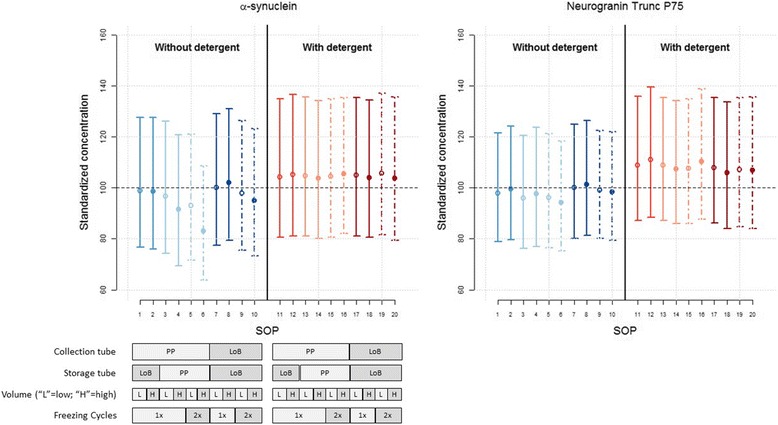
Fig. 3.

Standardized mean concentration for each CSF protocol and analyte. Standardized mean concentrations (±95% confidence intervals) for each CSF protocol, ordered from the highest to the lowest standardized concentration using protocol 7 as the reference. Numbers on the x axis correspond to the numbers described in the collection protocol (Fig. 1). Blue colors are linked to procedures without detergent, red colors with the addition of detergent at the time of collection. The line style is selected as a function of the collection procedure. Effect sizes and p values are described in Additional file 1: Table S3. LoB low protein binding, PP polypropylene, SOP standard operating procedure
