Fig. 1.

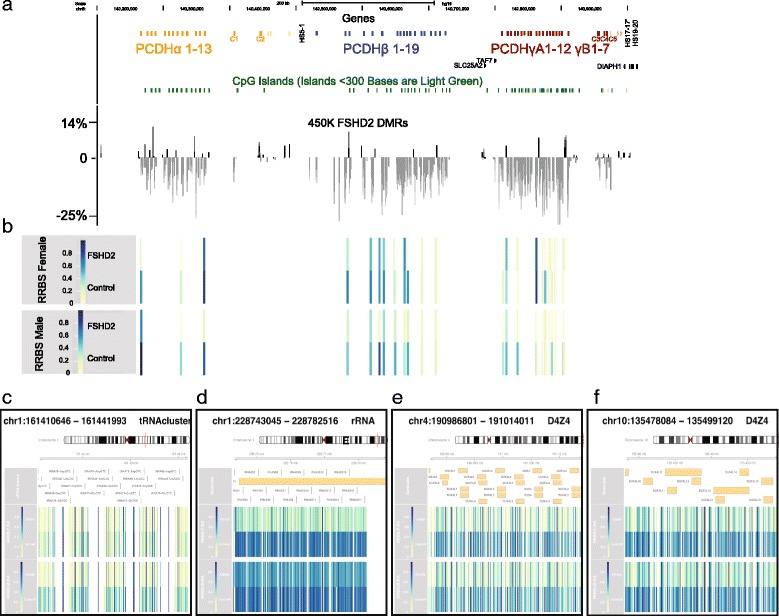
Hypomethylation of the PCDH cluster. a The top track depicts the location of each clustered gene as annotated by RefSeq and denotes the location of the hypersensitivity sites HS5-1 just distal of the PCDHα cluster and HS17-17′ and HS19-20 just distal of the PCDHγ cluster. The second track depicts all annotated CpG islands in the region, with CpG islands less than 300 bases being depicted in light green. The third track of the figure depicts the relative methylation difference in 24 SMCHD1 mutation carrying individuals in comparison to 23 controls at each recorded CpG in the 450k methylation analysis in the region of the clustered protocadherins on chromosome 5. The methylation value in controls was set to the baseline of 0 for each CpG. b Methylation heat maps from the RRBS analysis across the clustered protocadherin locus representing the relative methylation between control and FSHD2 individuals. The color scale is from yellow, no/low number of methylated CpGs at the locus to dark blue, high number of methylated CpGs. c–f Figures depict heat maps of relative methylation levels found by RRBS in FSHD2 and control individuals at the locations within (c) the tRNA cluster on chromosome 1, (d) the 5S rRNA cluster on chromosome 1, (e) the D4Z4 macrosatellite repeat on chromosome 4, and (f) the D4Z4 macrosatellite repeat on chromosome 10
