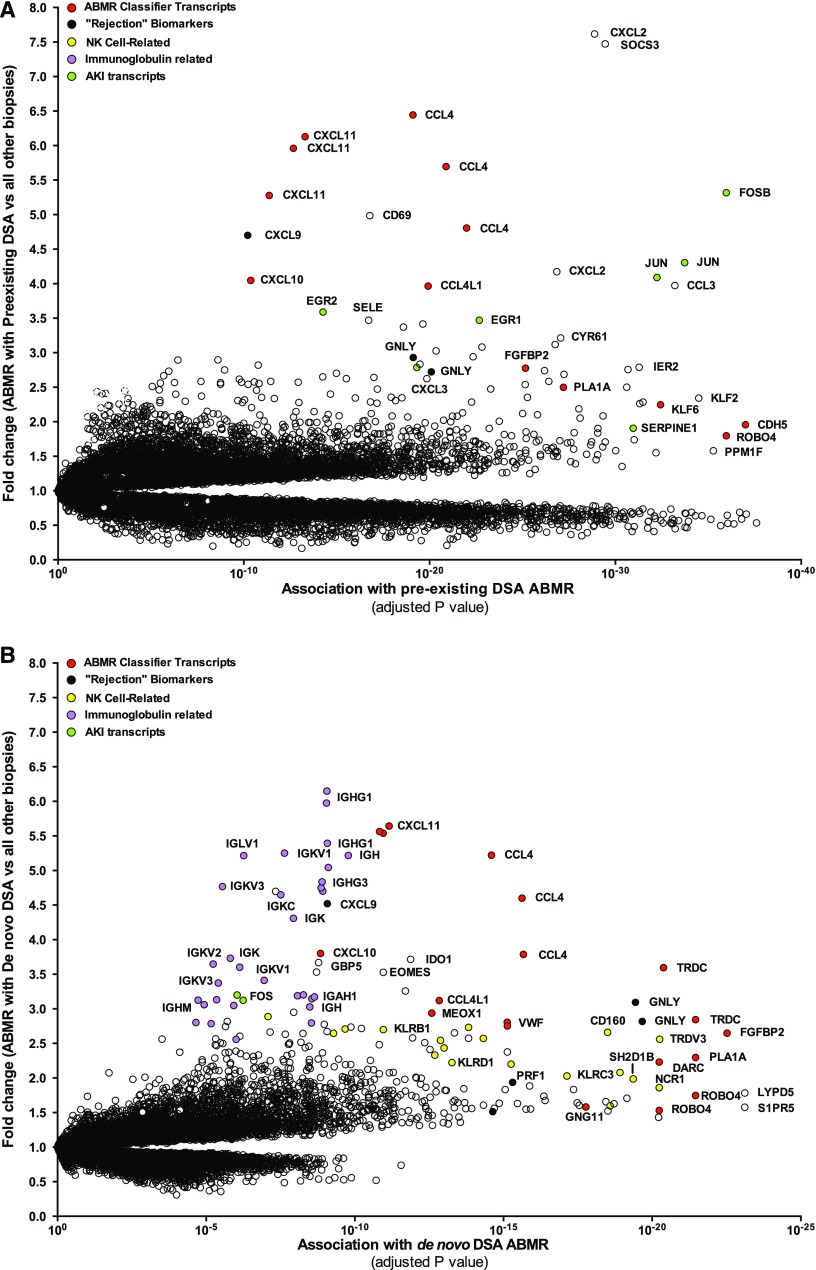
Figure 2.
Preexisting DSA ABMR and de novo DSA ABMR landscapes. (A) Expression of preexisting DSA ABMR transcripts in kidney allografts. (B) Expression of de novo DSA ABMR transcripts in kidney allografts. Dots represent individual probe sets on the microarray. The association strength (x-axis) is compared with fold change (y-axis) defined by ABMR versus all other biopsies of the control set (i.e., without ABMR). NK, natural killer cell.

