Figure 2.
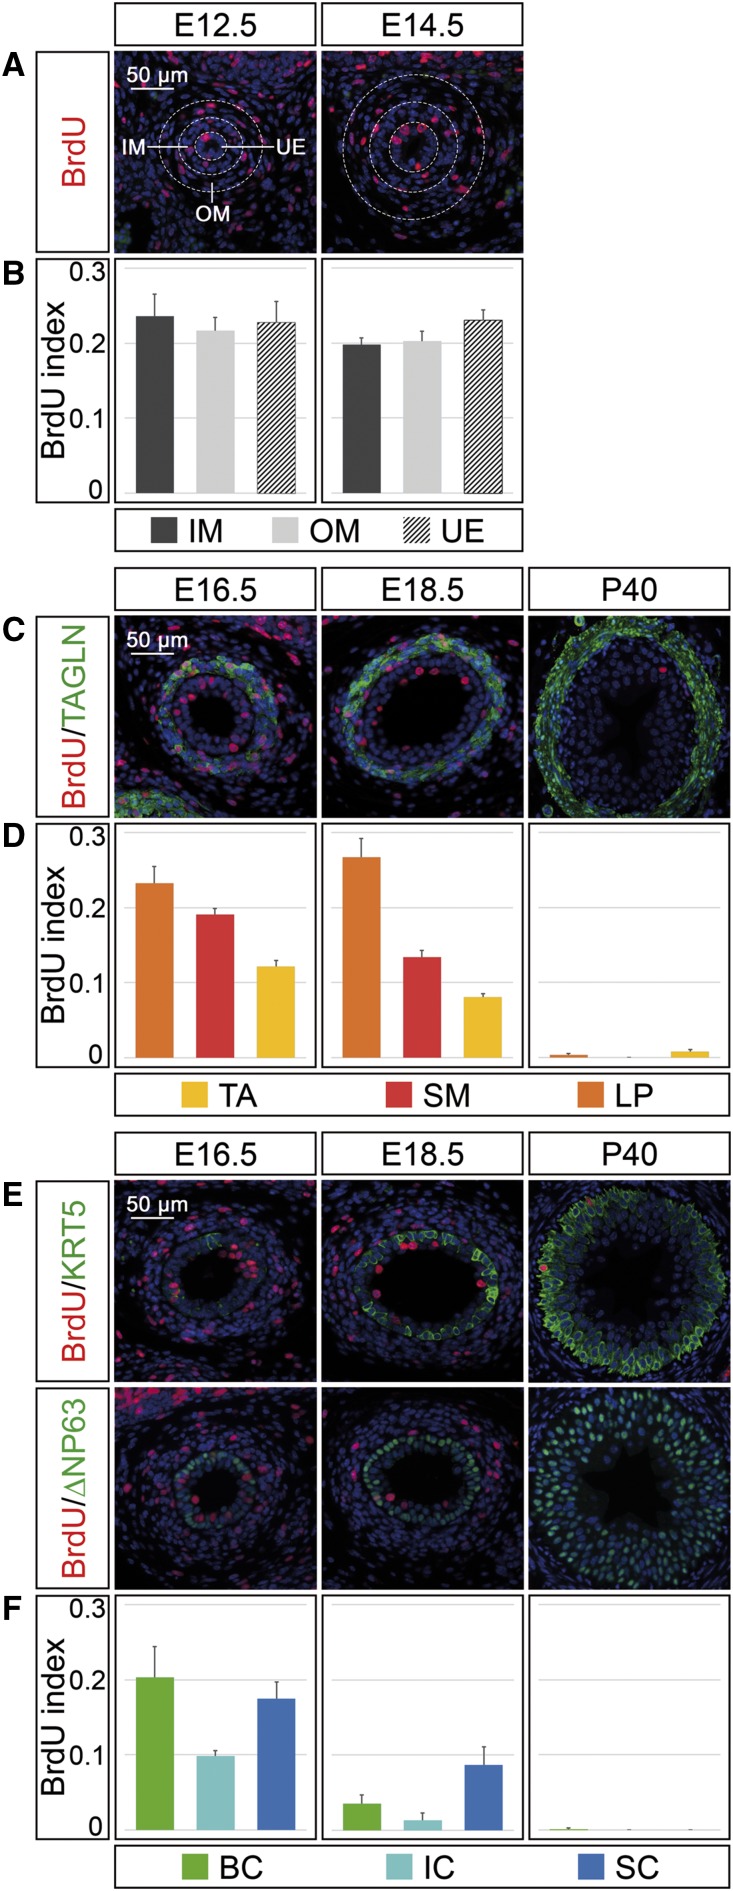
Proliferation rates explain differential cell-type expansion in the developing ureter. (A) Coimmunofluorescence analysis on proximal ureter sections at E12.5 and E14.5 for BrdU and the nuclear counterstain DAPI (blue). White dotted lines demarcate the ureteric epithelium (UE), and the inner and outer mesenchymal cell populations (IM and OM). (B) Quantification of cell proliferation by the BrdU index in the areas indicated in (A). (C) Coimmunofluorescence analysis on proximal ureter sections at E16.5, E18.5, and P40 for BrdU, the nuclear counterstain DAPI (blue), and the SM marker TAGLN. (D) Quantification of cell proliferation by the BrdU index in TAGLN− outer mesenchymal cells of the tunica adventitia (TA), in TAGLN+ smooth muscle cells (SM), and in TAGLN− inner mesenchymal cells of the lamina propria (LP). (E) Coimmunofluorescence on proximal ureter sections at E16.5, E18.5, and P40 for BrdU, the nuclear counterstain DAPI (blue), and the B cell marker KRT5 (upper row) and BrdU, the nuclear counterstain DAPI (blue), and the B and I cell marker ∆NP63 (lower row). (F) Quantification of cell proliferation by the BrdU index in KRT5+ B cells (BC), in KRT5+∆NP63+ I cells (IC), and KRT5−∆NP63− S cells (SC). For numbers see Supplemental Table 2, A–C.

