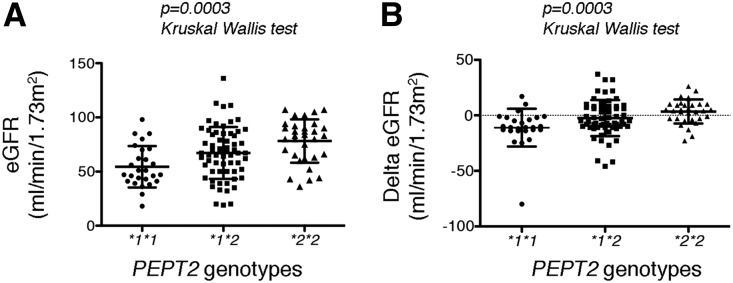
Figure 2.
Renal function is preserved in PEPT2*2 carriers. (A) Scatter dot plots showing distribution of the relative frequencies of eGFR values according to PEPT2 genotypes. The lines represent the mean and SD. Distributions were compared using the Kruskal–Wallis test. (B) Scatter dot plots showing distribution of the relative frequencies of the ΔeGFR values between 2013 and 2003 according to PEPT2 genotypes. The lines represent the mean and SD. Distributions were compared using the Kruskal–Wallis test.

