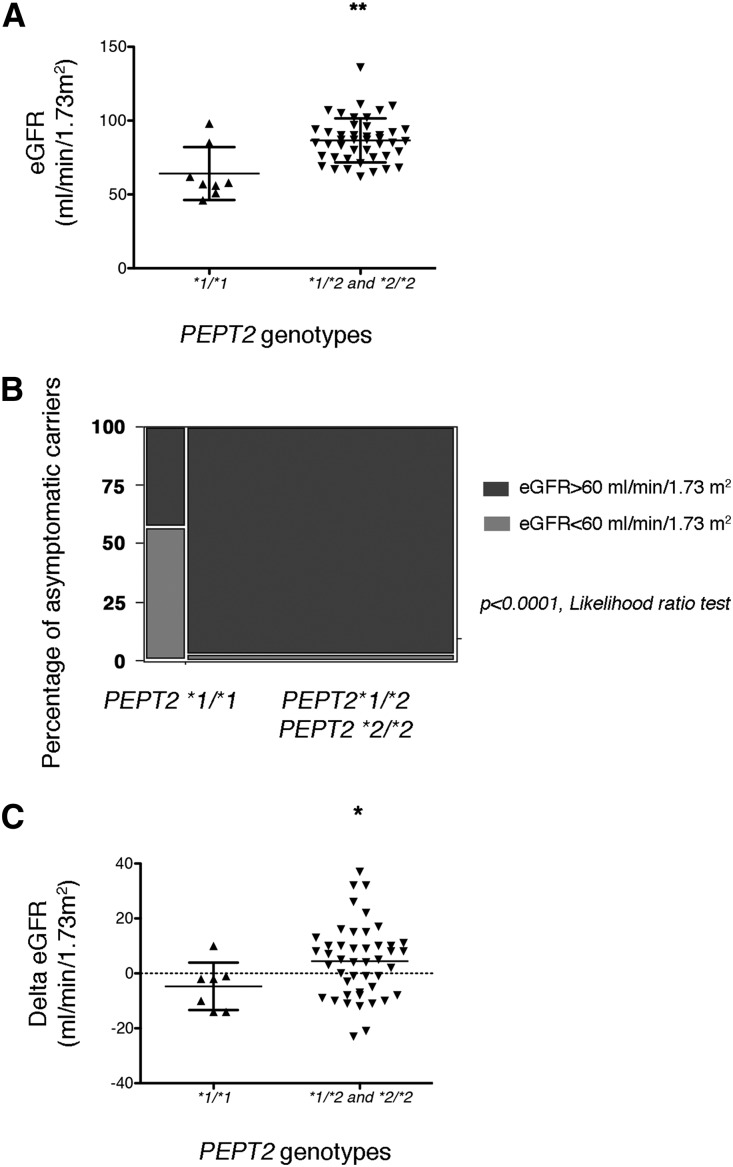
Figure 3.
PEPT2*2 is protective in asymptomatic carriers. (A) Scatter dot plots representing the distribution of eGFR according to the PEPT2 genotype in asymptomatic carriers compared with a Wilcoxon test. The lines represent the mean and SD. **P<0.01. (B). Graph representing the proportion of individuals with an eGFR<60 ml/min per 1.73 m2 according to PEPT2 genotype. Frequencies were compared with a likelihood ratio test. (C) Scatter dot plots representing the distribution of the difference of eGFRs between 2013 and 2003 according to the PEPT2 genotype in asymptomatic carriers compared with a Wilcoxon test. The lines represent the mean and SD. *P<0.05.

