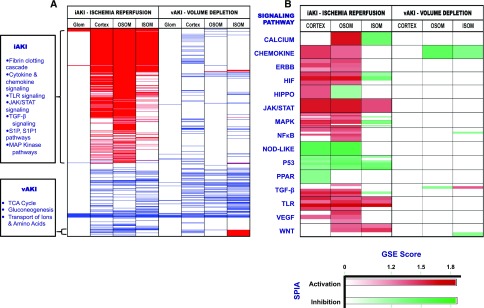
Figure 2.
Different patterning of iAKI and vAKI pathways. (A) Functional analyses using gene set enrichment analysis (GSEA) against KEGG, Reactome, Biocarta, and PID Pathway databases. Each row (thin lines) demonstrates a pathway found in one or more of the queried databases. Significant pathway enrichment is represented in a binary manner (enrichment=red; de-enrichment=blue; unchanged=white; false discovery rate <25%). (B) Functional analysis using GSEA was supplemented with signaling pathway impact analysis leveraging the topologic information available from canonical signaling pathways. Each horizontal division (boxes) contains an aggregate of gene sets ascribable to a known signaling pathway analyzed by one or more of the queried databases (i.e., KEGG, Reactome, Biocarta, PID). Each shaded row within the division represents an individual gene set analyzed by a single database; most signaling pathways were analyzed by multiple gene sets and databases. Pathway activation (red) or inhibition (green) was determined by signaling pathway impact analysis; the depth of shading of red or green reflects the degree of GSEA enrichment or de-enrichment.

