
Figure 2. [Aβ(M1-42)]DiY and [Aβ(M1-42)]Q-K form ThT positive assemblies at rates different to that of Aβ(M1-42).
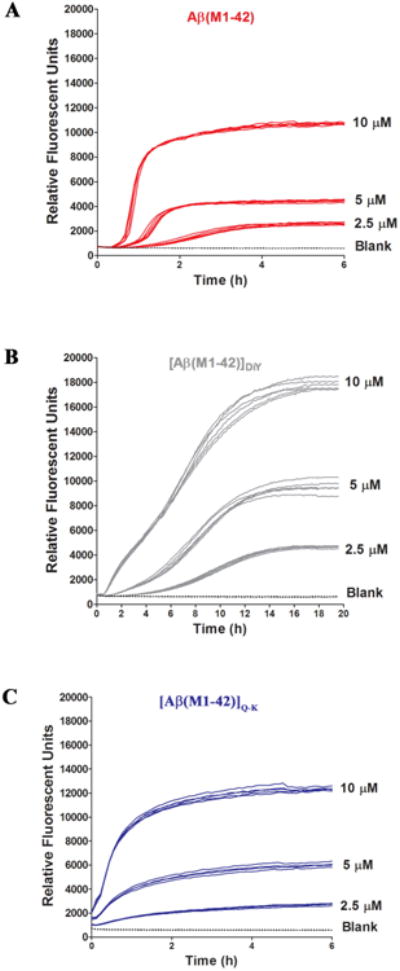
SEC-isolated (A) Aβ(M1-42), (B) [Aβ(M1-42)]DiY and (C) [Aβ(M1-42)]Q-K were diluted to 10.1 μM with 20 mM sodium phosphate pH 8.0 containing 200 μM EDTA and 0.02% NaN3 and combined with 2 mM ThT to yield a solution of 10 μM Aβ and 20 μM ThT. Serial dilutions of peptide (5 μM and 2.5 μM) were prepared in low binding tubes using phosphate buffer containing 20 μM ThT. Six, 100 μl replicates of each concentration for a given peptide were transferred to a 96 well, half-area plate and fluorescence was measured at five minute intervals (Ex440, Em480). Curves show high reproducibility between replicates. There is a concentration dependent effect on lag, rate and extent of ThT fluorescence for all peptides. As a control, buffer alone containing 10 μM ThT but no Aβ (blank) was also analyzed. Data shown are representative of a total of 3 experiments. To better appreciate differences in the early phase of aggregation, data for the first 2 hours are shown in Supplementary Figure 6.