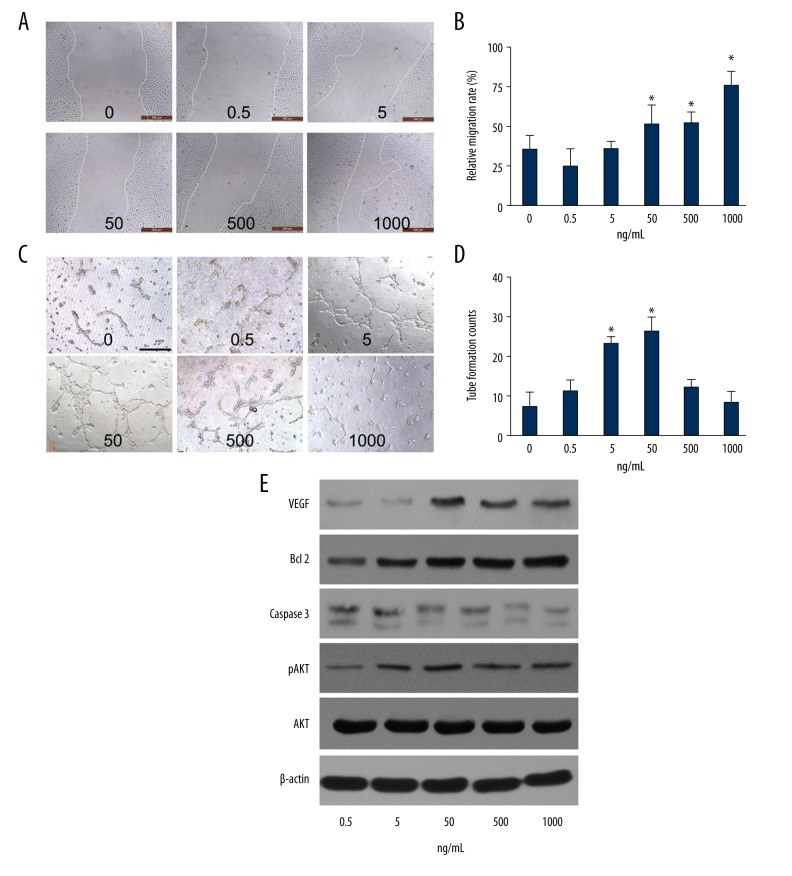
Figure 4.
G-CSF promoted the angiogenic potential of HUVECs in vitro. (A) Representative images depicting the effect of the G-CSF treatment at 12 h on HUVEC migration at the indicated concentrations. (B) Statistically calculated relative migration rates; Scale bar=500 μm. (C) Typical images of the tube-like structures in the presence of G-CSF cultured on Matrigel for 12 h. (D) The amounts of capillary-like structures; Scale bar=200 μm. (E) Western blot of VEGF, Bcl 2, Caspase 3, phosphorylated AKT (pAKT) as well as the total AKT and β-actin expressions at different concentrations of G-CSF; the HUVECs were pre-incubated with G-CSF for 24 h then followed by H2O2 stimulation (50 μmol/L) to determine the protein activities by Western blot. Each experiment was repeated 3 times and typical pictures are shown. Data are shown as mean ±SD. * P<0.05 versus HUVECs without G-CSF stimulation.

