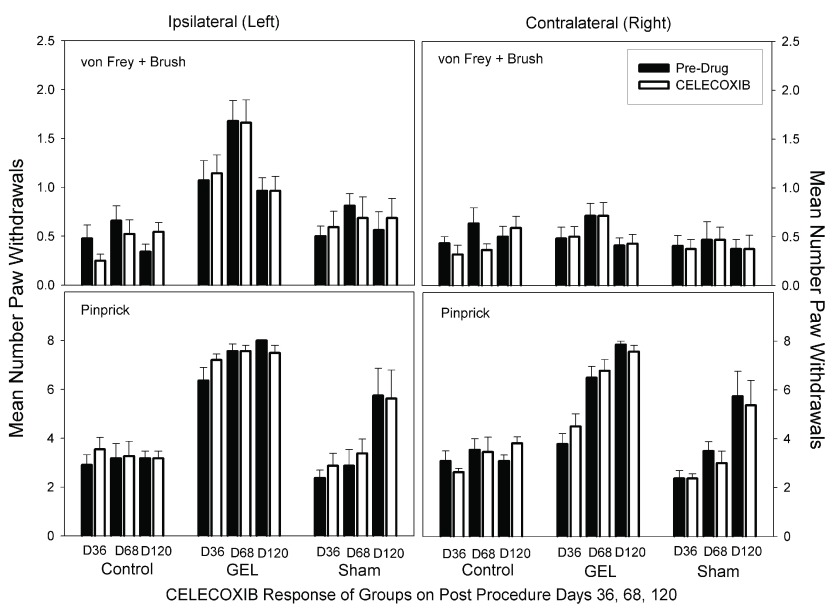
Figure 8. Celecoxib analgesia results.
Graph depicts average of paw withdrawals on pre-drug control days (black) and on paired celecoxib dose days (white). Results of behavior testing show the average of all four light touch allodynia measures (three von Frey fibers and the brush, top graphs) and the mechanical hyperalgesia (pinprick, bottom graphs). Mean and S.E.M. Celecoxib did not significantly reduce paw withdrawal responses on any pair of days for any groups. GEL n = 14, sham n = 8, control n = ll.

