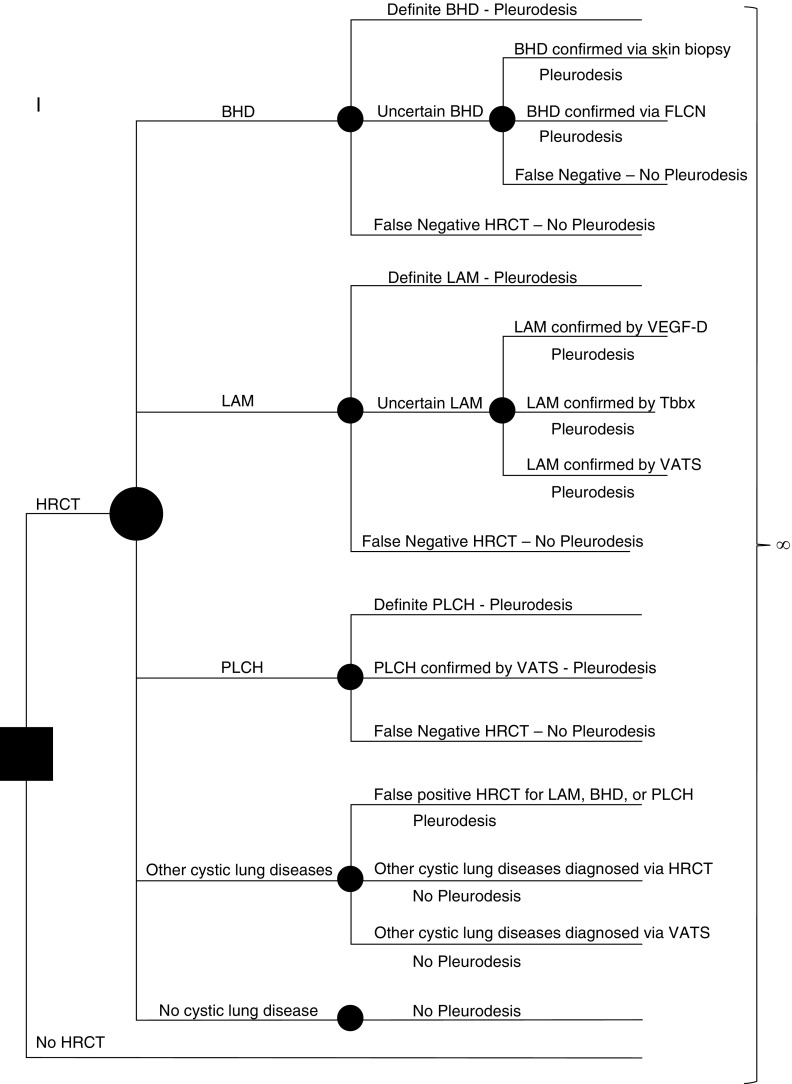
Figure 1.
Simplified schematic of the model used in our analysis. The solid square represents the decision node where the initial decision is made by the practicing clinician—to obtain a high-resolution computed tomography (HRCT) scan or not. Each solid circle represents a chance node, where the likelihood of a given outcome is defined by a probability entered into the model. Patients presenting with a pneumothorax can have one of the following five scenarios: underlying Birt-Hogg-Dubé syndrome (BHD), underlying lymphangioleiomyomatosis (LAM), underlying pulmonary Langerhans cell histiocytosis (PLCH), other cystic lung diseases, or no cystic lung disease. The probability of the presence of each of these five scenarios is entered into the model. Further testing for diagnostic confirmation is based on the sensitivity and specificity of HRCT to accurately diagnose LAM, BHD, or PLCH. The performance characteristics of each diagnostic test are also considered when assigning a correct diagnosis, and the rates of false-positive and false-negative diagnoses are accounted for at each step. Each arm of the tree ultimately ends in the Markov node (∞ symbol). In each state, costs and quality adjustment factors are applied and tabulated. FLCN = folliculin; Tbbx = transbronchial biopsy; VATS = video-assisted thoracoscopic surgery; VEGF-D = vascular endothelial growth factor-D.

