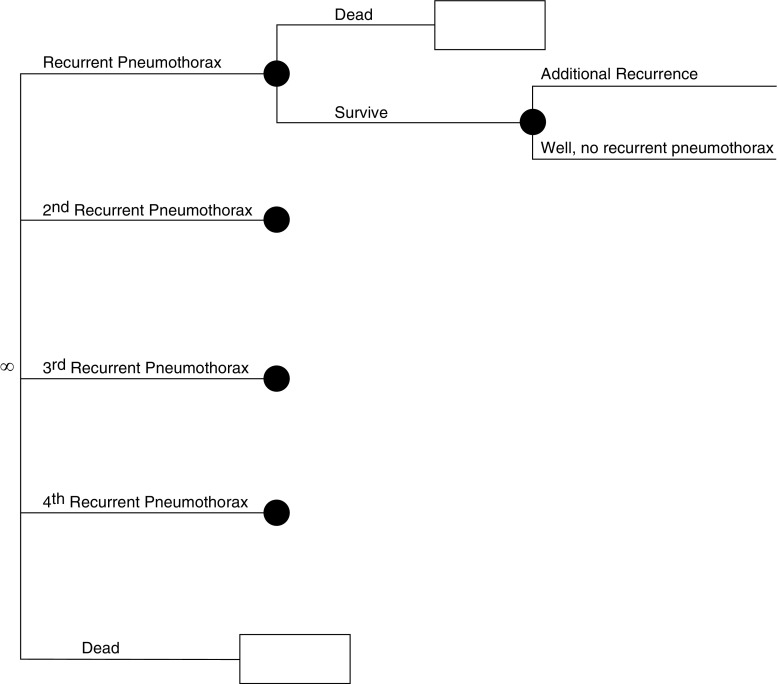
Figure 2.
Simplified schematic of the model used in our analysis. This figure depicts the continuation of our model. In the Markov node (∞ symbol), patients progress through various health states dictated by probabilities entered into the model. These probabilities are different, depending on how the individual entered the Markov node (e.g., a patient with cystic lung disease [lymphangioleiomyomatosis (LAM), Birt-Hogg-Dubé syndrome (BHD), or pulmonary Langerhans cell histiocytosis (PLCH)] who has undergone pleurodesis has a lower probability of recurrent pneumothorax than a patient who has not). In each cycle (defined as 1 mo), patients are subjected to risk of recurrent pneumothorax or age/sex-related death, as well as disease-specific additional mortality as applicable to patients with LAM and PLCH. In each state, costs and quality adjustment factors are applied and tabulated. These cycles repeat until all patients are dead. Outcomes can then be compared for each strategy tested (high-resolution computed tomography [HRCT] vs. no HRCT).

