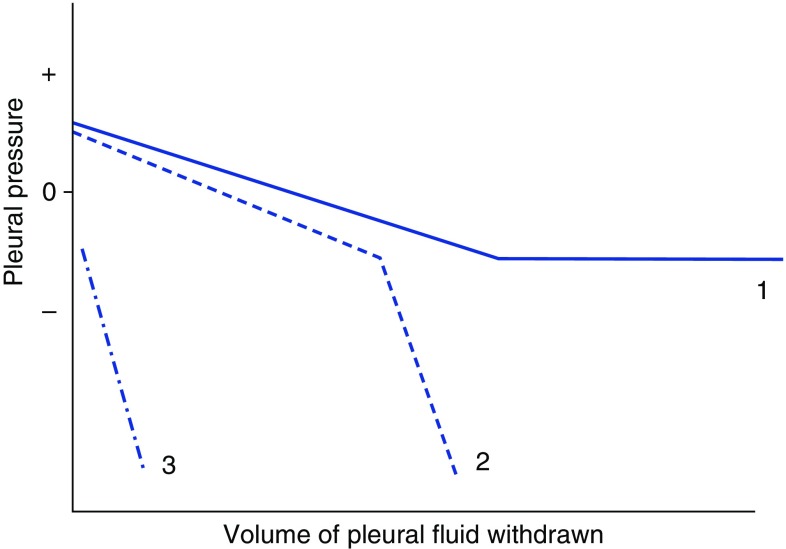
Figure 6.
Three distinct pleural elastance curves can be encountered when monitoring pleural pressure changes during a thoracentesis. Curve 1 depicts a well-performed thoracentesis in the setting of normal underlying lung and visceral pleura, where an initially positive pleural pressure gradually returns to the resting subatmospheric pressure of the pleural space with fluid removal. Curve 2 depicts lung entrapment, where pleural pressure rapidly falls when a diseased visceral pleura prevents full lung reexpansion. A similar elastance profile may be encountered when chronic atelectasis creates an area of poorly compliant lung that requires significant negative pressure for reexpansion. Curve 3 represents a trapped lung, where an initially negative pleural pressure is encountered, indicating a chronically unexpanded lung and a pleural effusion ex vacuo.

