
Figure 2.
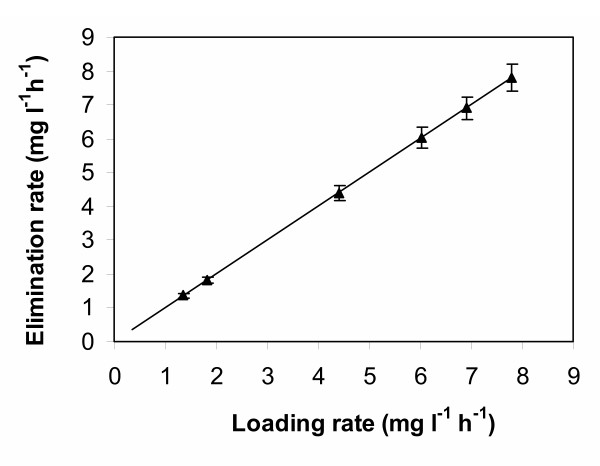
Toluene elimination rate of column 2 plotted as a function of toluene loading rate. Loading rate was increased over a 12-month period as described in the text.
Official websites use .gov
A
.gov website belongs to an official
government organization in the United States.
Secure .gov websites use HTTPS
A lock (
) or https:// means you've safely
connected to the .gov website. Share sensitive
information only on official, secure websites.
Toluene elimination rate of column 2 plotted as a function of toluene loading rate. Loading rate was increased over a 12-month period as described in the text.