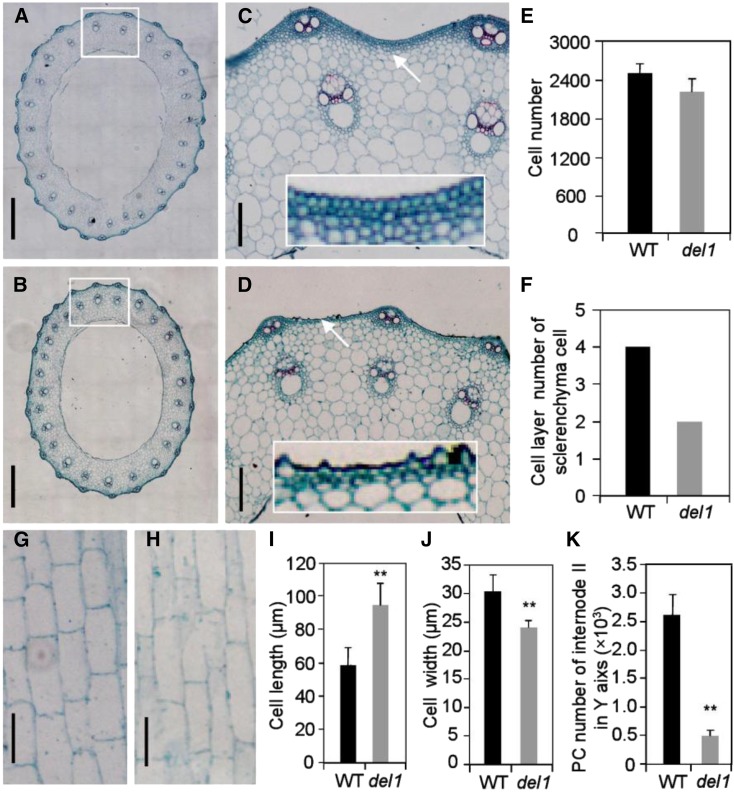
Figure 2.
Histological characterization of culms in wild-type and del1 plants. A to D, Cross sections of internode II of wild type (A) and del1 (B). Scale bar = 500 μm. C, Magnification of A; D, magnification of B; white rectangle shows a magnification of the sclerenchyma cell layer. Scale bar = 50 μm. E and F, Statistical analysis of cell number and sclerenchyma cell layer number between wild-type and del1 plants, means ± sd of five independent replicates. G and H, Longitudinal sections of internode II of wild type (G) and del1 (H). Scale bar = 50 μm. I and J, Statistical analysis of the cell length and cell width between wild-type and del1 plants, mean ± sd of 30 cells. **P < 0.01 (Student’s t test). K, Number of parenchyma cells (PCs) for internode II of wild-type and del1 plants, mean ± sd of five independent replicates.

